Philosophy
AlgebraOfGraphics aims to be a declarative, question-driven language for data visualizations. This section describes its main guiding principles.
From question to plot
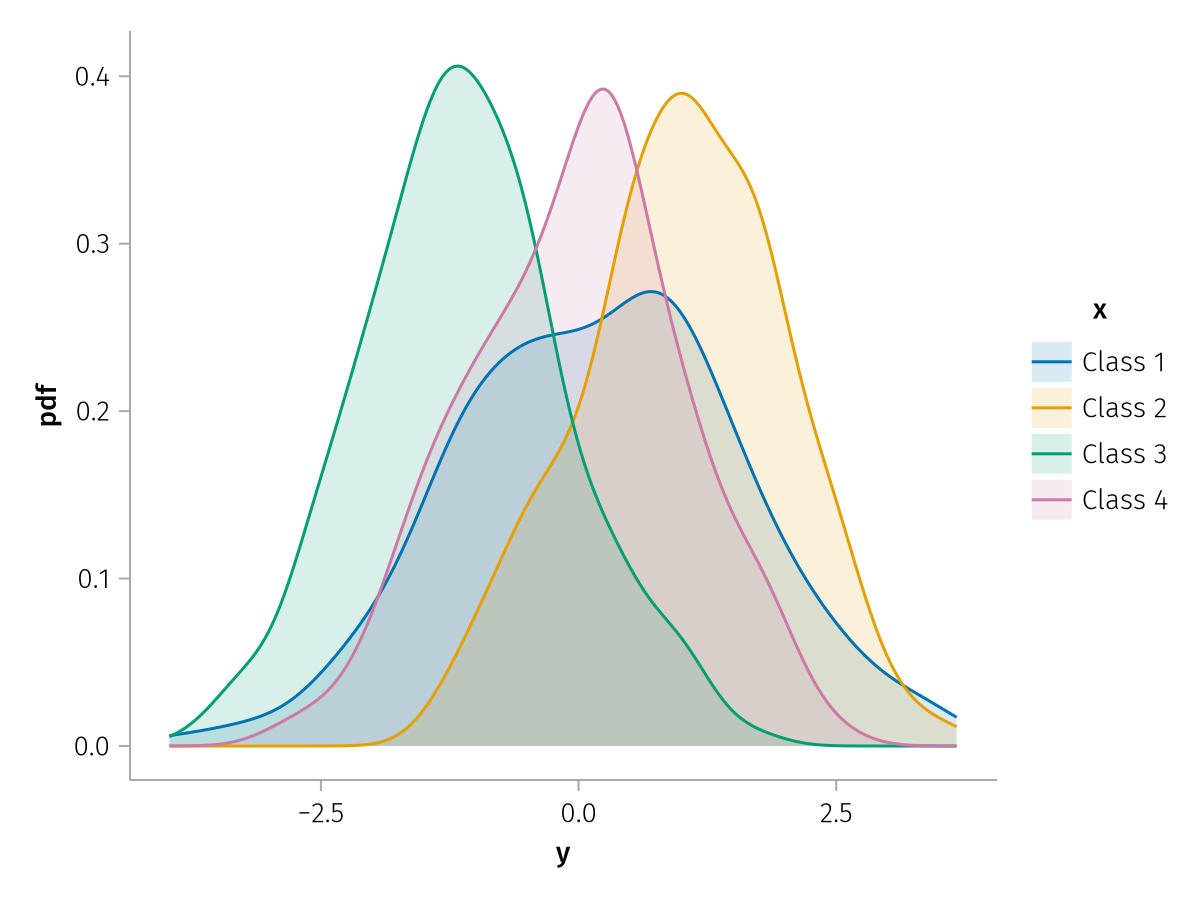
When analyzing a dataset, we often think in abstract, declarative terms. We have questions concerning our data, which can be answered by appropriate visualizations. For instance, we could ask whether a discrete variable :x affects the distribution of a continuous variable :y. We would then like to generate a visualization that answers this question.
In imperative programming, this would be implemented via the following steps.
Pick the dataset.
Divide the dataset into subgroups according to the values of
:x.Compute the density of
:yon each subgroup.Choose a plot attribute to distinguish subgroups, for instance
color.Select as many distinguishable colors as there are unique values of
:x.Plot all the density curves on top of each other.
Create a legend, describing how unique values of
:xare associated to colors.
While the above procedure is certainly feasible, it can introduce a cognitive overhead, especially when more variables and attributes are involved.
In a declarative framework, the user needs to express the question, and the library will take care of creating the visualization. Let us solve the above problem in a toy dataset.
plt = data(df) # declare the dataset
plt *= density() # declare the analysis
plt *= mapping(:y) # declare the arguments of the analysis
plt *= mapping(color = :x) # declare the grouping and the respective visual attribute
draw(plt) # draw the visualization and its legend
No mind reading
Plotting packages requires the user to specify a large amount of settings. The temptation is then to engineer a plotting library in such a way that it would guess what the user actually wanted. AlgebraOfGraphics follows a different approach, based on algebraic manipulations of plot descriptors.
The key intuition is that a large fraction of the "clutter" in a plot specification comes from repeating the same information over and over. Different layers of the same plot will share some but not all information, and the user should be able to distinguish settings that are private to a layer from those that are shared across layers.
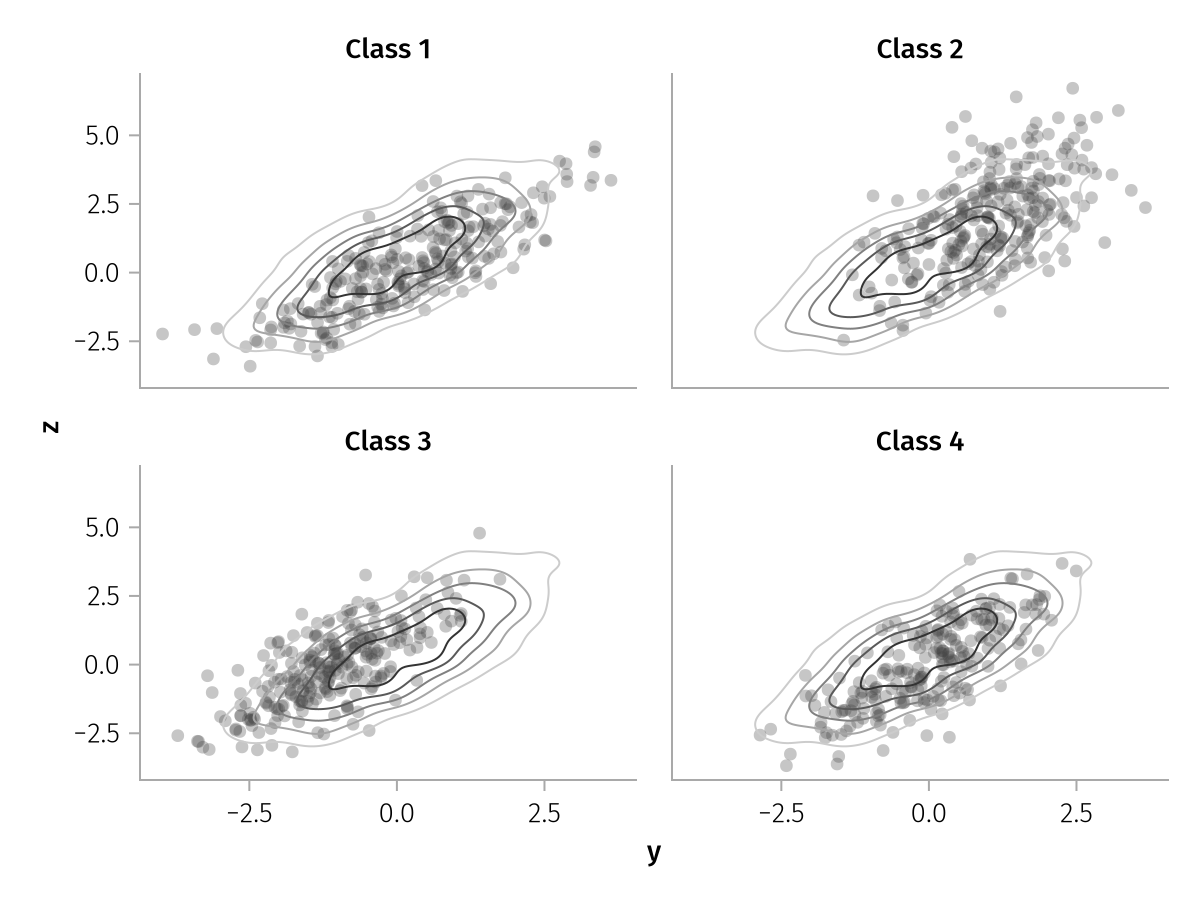
We achieve this goal using the distributive properties of addition and multiplication. This is best explained by example. Let us assume that we wish to visually inspect whether a discrete variable :x affects the joint distribution of two continuous variables, :y and :z.
We would like to have two layers, one with the raw data, the other with an analysis (kernel density estimation).
Naturally, the axes should represent the same variables (:y and :z) for both layers. Only the density layer should be a contour plot, whereas only the scatter layer should have some transparency and be grouped (according to :x) in different subplots.
plt = data(df) *
    (
        visual(Scatter, alpha = 0.3) * mapping(layout = :x) +
        density() * visual(Contour, colormap = Reverse(:grays))
    ) *
    mapping(:y, :z)
draw(plt)
In this case, thanks to the distributive property, it is clear that the dataset and the positional arguments :y, :z are shared across layers, the transparency and the grouping are specific to the data layer, whereas the density analysis, the Contour visualization, and the choice of color map are specific to the analysis layer.
User-defined building blocks
It is common in data analysis tasks to "pipe" a sequence of operations. This became very popular in the data science field with the %>% operator in the R language, and it can allow users to seamlessly compose a sequence of tasks:
df %>%
    filter(Weight < 3) %>%
    group_by(Species) %>%
    summarise(avg_height = mean(Height))
Naturally, the alternative would be to create a statement per operation and to assign each intermediate result to its own variable.
AlgebraOfGraphics is markedly in favor of the latter approach. It is recommended that commonly used building blocks are stored in variables with meaningful names. If we often make a scatter plot with some transparency, we can create a variable transparent_scatter = visual(Scatter, alpha = 0.5) and use it consistently. If some columns of our dataset are always analyzed together, with a similar set of transformations, we can store that information as variables = mapping(variable1 => f1 => label1, variable2 => f2 => label2).
Working over one or more datasets, the user would then create a library of building blocks to be combined with each other with * and +. These two operators allow for a much larger number of possible combinations than just sequential composition, thus fully justifying the extra characters used to name intermediate entities.
Opinionated defaults
While users should be able to customize every aspect of their plots, it is important to note that this customization can be very time-consuming, and many subtleties can escape the attention of the casual user:
Is the color palette colorblind-friendly?
Would the colors be distinguishable in black and white (when printed)?
Is the color gradient perceptually uniform?
Are the labels and the ticks legible for readers with low vision?
Are the spacing and typographic hierarchies respected?
To remedy this, AlgebraOfGraphics aims to provide solid, opinionated default settings. In particular, it uses a conservative, colorblind-friendly palette and a perceptually uniform, universally readable color map. It follows IBM guidelines to differentiate titles and labels from tick labels via font weight, while using the same typeface at a readable size.
Multiple data formats
Data naturally comes in different shapes depending on how it was collected or organized. AlgebraOfGraphics is designed to work flexibly with your data rather than forcing you to reshape it first.
The two most common tabular formats are long and wide. In long format, each row represents one observation, with columns for variables and grouping information. In wide format, multiple related measurements are spread across different columns. While long format leads to simpler AlgebraOfGraphics code (mappings are just column symbols), wide format is sometimes more natural for your data source.
This flexibility is achieved in three ways. First, the Tables interface ensures integration with a large variety of data sources. Second, using wide data syntax with multidimensional mappings, users can plot many columns together without first reshaping to long format. Finally, tabular datasets are not a requirement: users may also work directly with Pre-grouped data, which are not organized as a table, but rather as a collection of (possibly multi-dimensional) arrays.
For a detailed comparison of long and wide formats with conversion examples, see Long vs Wide Data Formats.