Intro to AoG - VII - Multiple scales for one aesthetic
In the previous tutorials, you have already learned about aesthetics and the categorical or continuous scales that use them. However, so far we've only used one scale of a given type within a plot, for example one color scale, or one set of markers.
There are situations where this is not enough and you need more flexibility. AlgebraOfGraphics solves this problem by allowing you to give scales different ids.
One example for such a scenario is when you want to plot one column from a dataset against multiple others in a facet layout. In the default case, every facet in an AoG layout will have the same x and y scale (even though as we've seen in the wide data tutorial, the axis labels may differ).
However, we can create multiple layers, where each layer assigns a different scale id to its x scale, which will allow categorical and continuous scales to coexist in the same layout. For that to work, we just have to take care that the facets of these layers don't mix, that means, each layer gets its own facet.
using AlgebraOfGraphics
using CairoMakie
using DataFrames

penguins = DataFrame(AlgebraOfGraphics.penguins())

cols = [:flipper_length_mm, :island, :bill_depth_mm, :species]

# using sum is a neat trick to create a stack of layers from an iterator
layers = sum(enumerate(cols)) do (i, column)
    # generate some unique id for the scale, here X1, X2, etc.
    scaleid = Symbol("X", i)

    # decide the plot type based on the column type
    plottype = penguins[!, column] isa AbstractVector{<:Number} ? Scatter : Violin

    mapping(
        # here we assign a different scale to each x mapping
        column => scale(scaleid),
        :bill_length_mm;
        col = direct("$i"),
    ) * visual(plottype)
end

spec = data(penguins) * layers

draw(spec; axis = (; xticklabelrotation = pi/4, xticklabelspace = 55))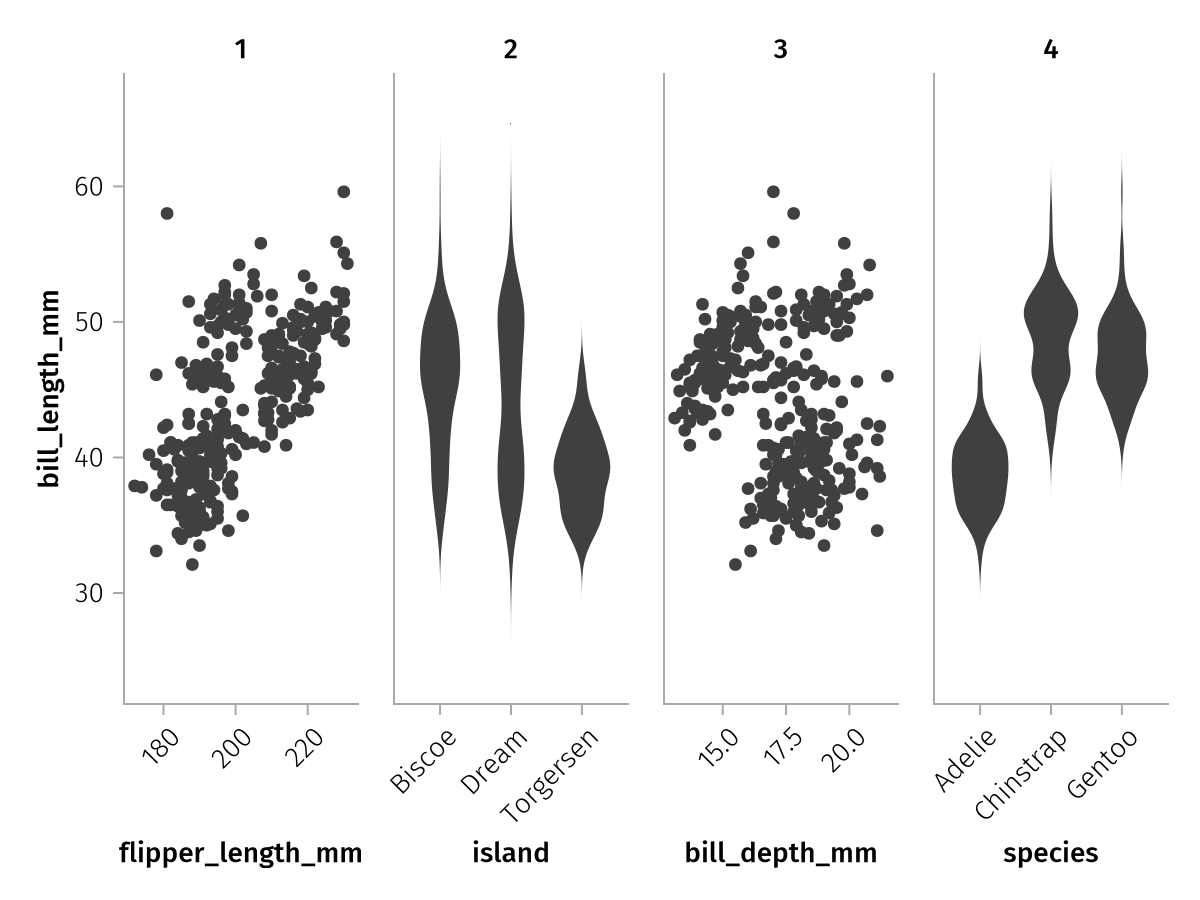
And there we have a plot with four different x axes, including two continuous and two separate categorical ones.
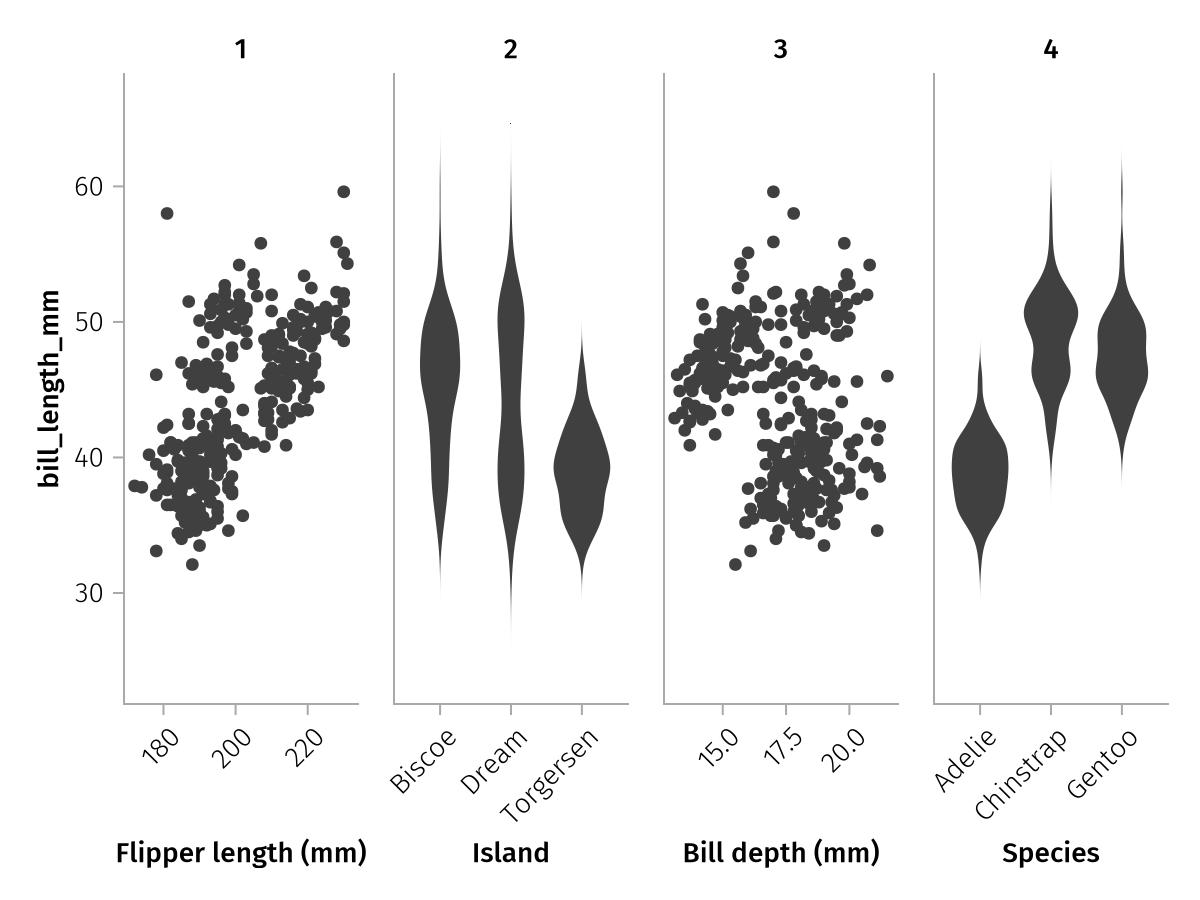
When we explicitly give ids to scales, we can use those ids in the scale settings. For example, this is how we could set the four x axis labels:
draw(
    spec,
    scales(
        X1 = (; label = "Flipper length (mm)"),
        X2 = (; label = "Island"),
        X3 = (; label = "Bill depth (mm)"),
        X4 = (; label = "Species"),
    );
    axis = (; xticklabelrotation = pi/4, xticklabelspace = 55)
)
The same method applies to other scales as well. Let's say we want to want to layer bounding boxes on top of our penguins, because we have grouped them in some way. Let's try this plot first without split scales:
using Makie.GeometryBasics: Polygon

flipper_vs_mass = data(penguins) *
    mapping(:flipper_length_mm, :body_mass_g, color = :species) *
    visual(Scatter)

boundingboxes = (
    rects = [
        Rect2f((168, 2500), (40, 2500)),
        Rect2f((200, 4000), (36, 2500)),
    ],
    class = ["Short and light", "Long and heavy"],
)

rectangles = data(boundingboxes) *
    mapping(:rects, color = :class) *
    visual(Poly, alpha = 0.2)

draw(rectangles + flipper_vs_mass)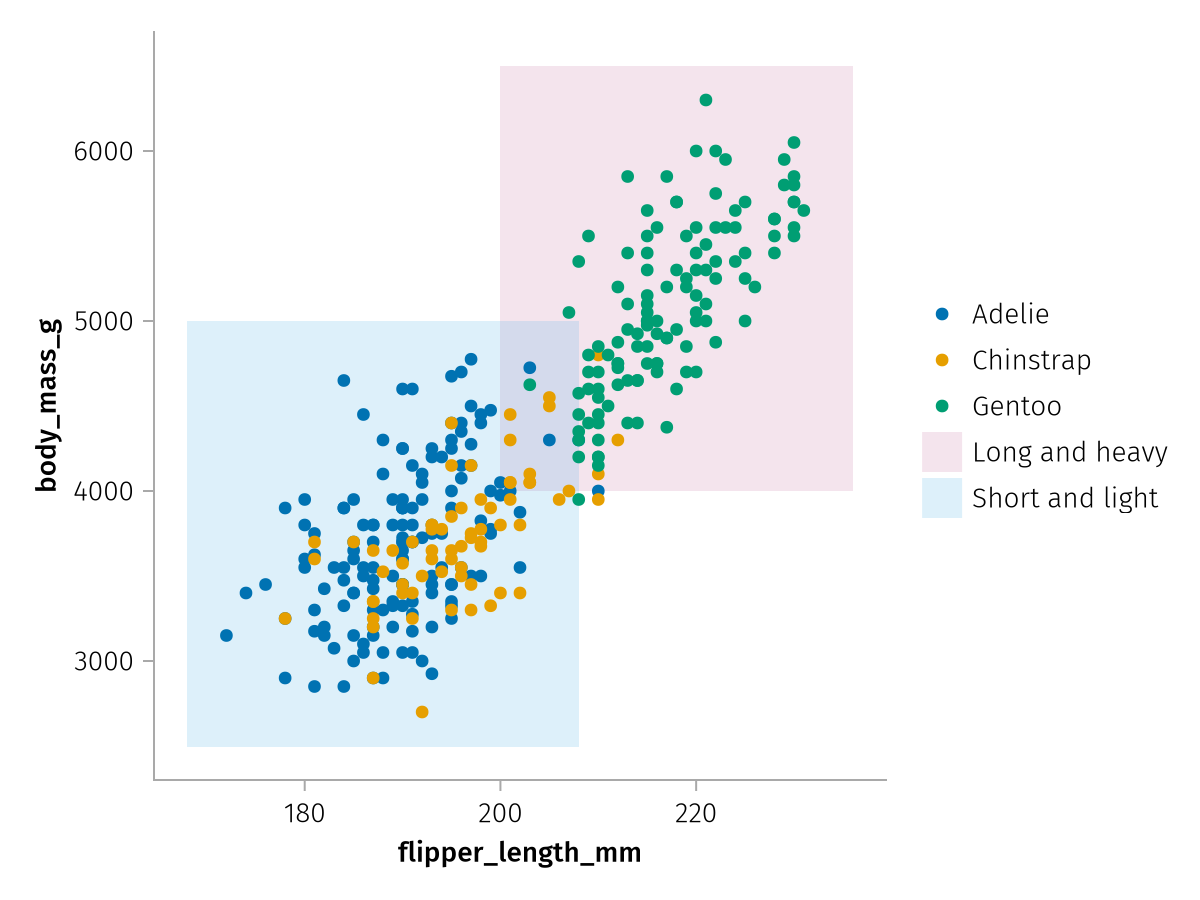
The species categories have been merged with the boundingbox categories to form a single color scale, which doesn't make sense.
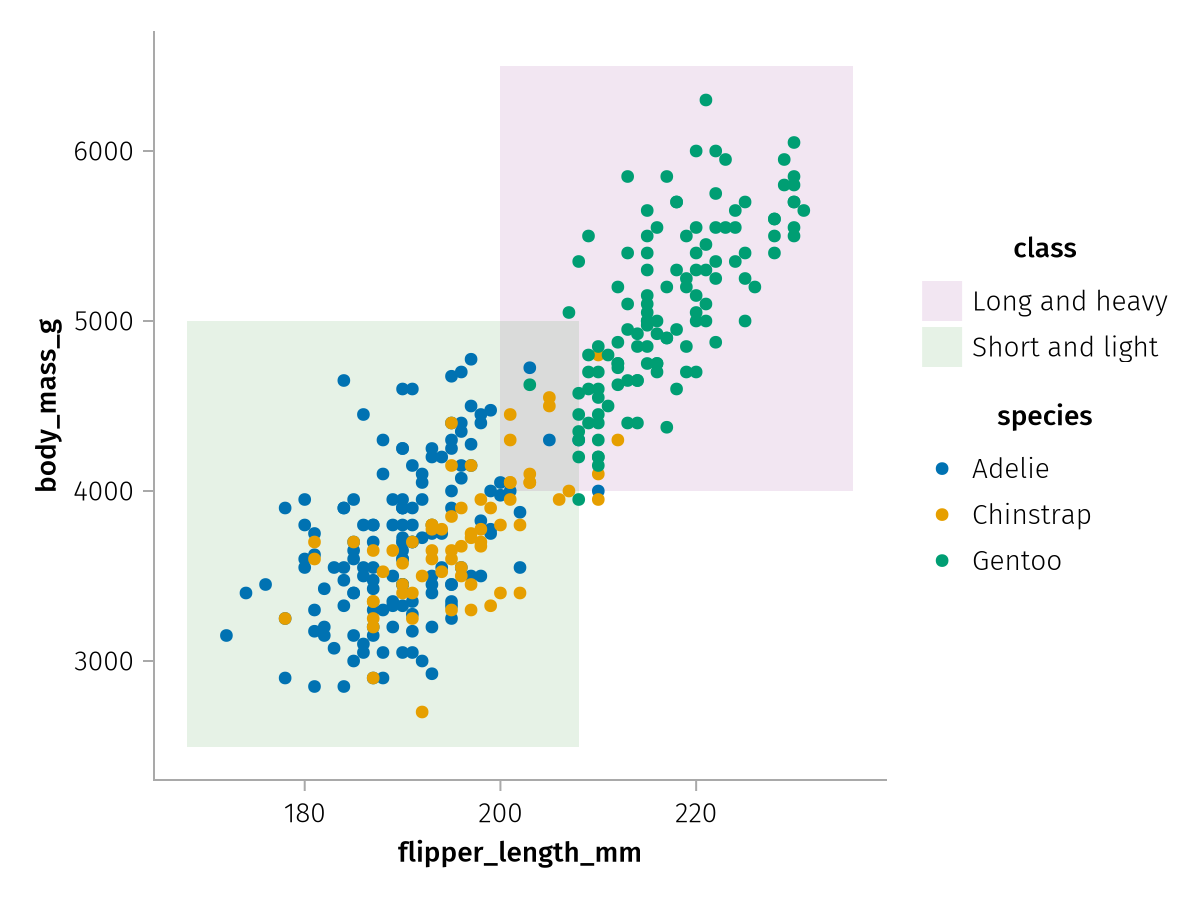
In order to split them, it is enough to assign a separate id to one of the layers, which we can then use in the scales settings to pick a different palette:
rectangles_separate_id = data(boundingboxes) *
    mapping(:rects, color = :class => scale(:RectColor)) *
    visual(Poly, alpha = 0.1)

draw(
    rectangles_separate_id + flipper_vs_mass,
    scales(
        RectColor = (; palette = [:purple, :green])
    )
)
Summary
In this chapter, you've learned how you can use multiple independent scales of the same aesthetic type using scale ids. The scenarios in which this technique can be used might be less common, but it's good to know that you have the option available when the need does arise.