Units
AlgebraOfGraphics supports input data with units, currently Unitful.jl and DynamicQuantities.jl have extensions implemented.
Let's first create a unitful version of the penguins dataset:
using AlgebraOfGraphics
using CairoMakie
using Unitful
using DataFrames

df = DataFrame(AlgebraOfGraphics.penguins())
df.bill_length = df.bill_length_mm .* u"mm"
df.bill_depth = uconvert.(u"cm", df.bill_depth_mm .* u"mm")
df.flipper_length = df.flipper_length_mm .* u"mm"
df.body_mass = df.body_mass_g .* u"g"
select!(df, Not([:bill_length_mm, :bill_depth_mm, :flipper_length_mm, :body_mass_g]))

first(df, 5)| Row | species | island | sex | bill_length | bill_depth | flipper_length | body_mass |
|---|---|---|---|---|---|---|---|
| String | String | String | Quantity… | Quantity… | Quantity… | Quantity… | |
| 1 | Adelie | Torgersen | male | 39.1 mm | 1.87 cm | 181 mm | 3750 g |
| 2 | Adelie | Torgersen | female | 39.5 mm | 1.74 cm | 186 mm | 3800 g |
| 3 | Adelie | Torgersen | female | 40.3 mm | 1.8 cm | 195 mm | 3250 g |
| 4 | Adelie | Torgersen | female | 36.7 mm | 1.93 cm | 193 mm | 3450 g |
| 5 | Adelie | Torgersen | male | 39.3 mm | 2.06 cm | 190 mm | 3650 g |
When we plot columns with units, the units are automatically appended to the respective labels:
spec = data(df) *
    mapping(:bill_length, :bill_depth, color = :body_mass) *
    visual(Scatter)
draw(spec)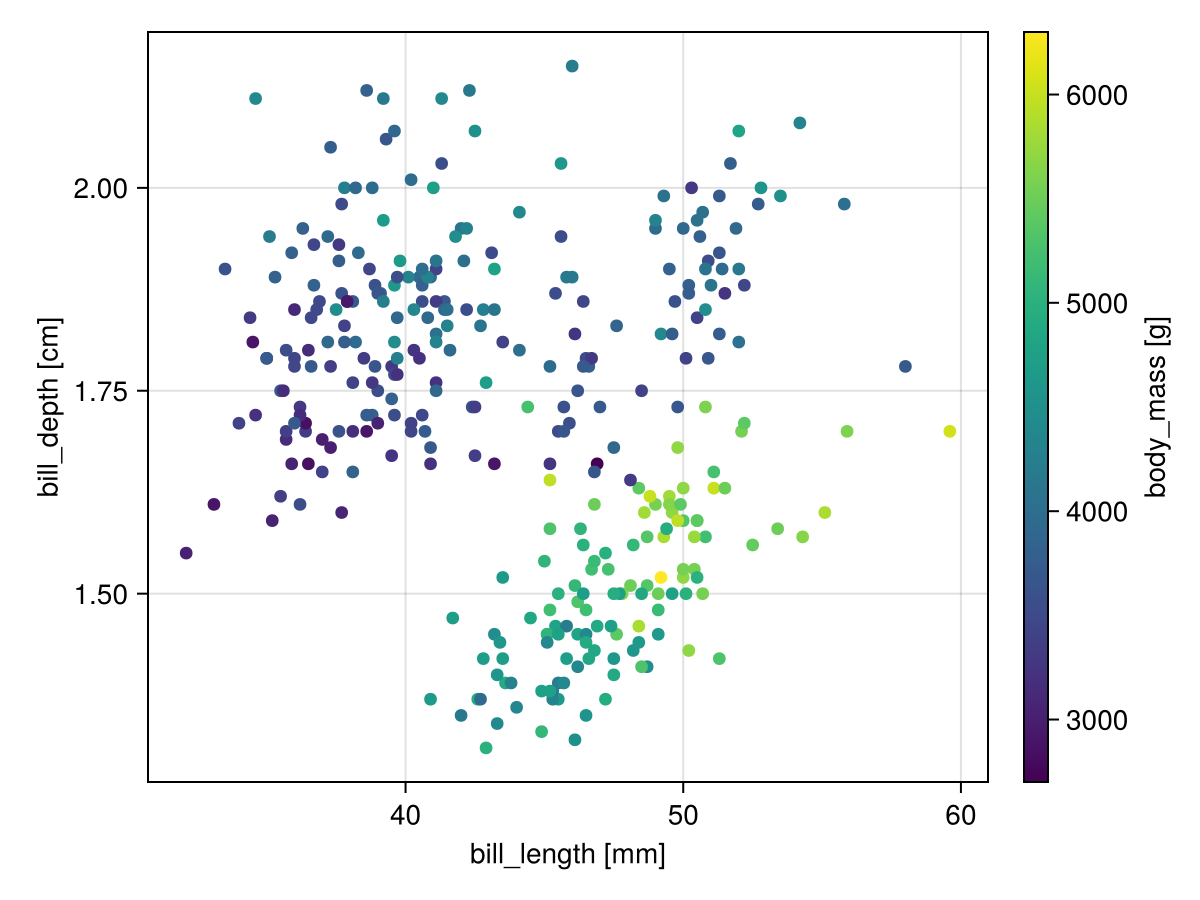
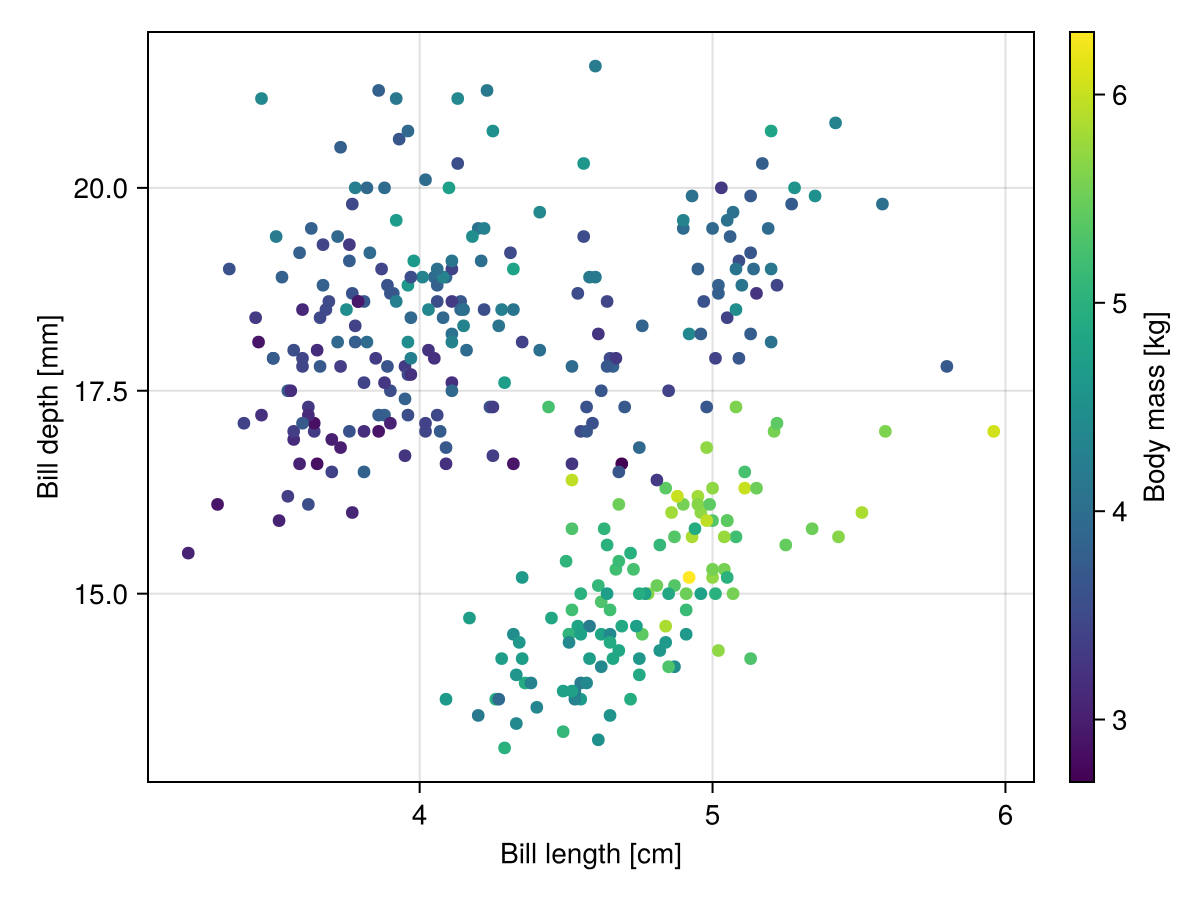
Labels are separate from units, so we can relabel without affecting the unit suffixes:
spec = data(df) *
    mapping(:bill_length => "Bill length", :bill_depth => "Bill depth", color = :body_mass => "Body mass") *
    visual(Scatter)
draw(spec)
We can choose a different display unit per scale via the unit scale property:
draw(
    spec,
    scales(
        X = (; unit = u"cm"),
        Y = (; unit = u"mm"),
        Color = (; unit = u"kg")
    )
)
If we plot different units on the same scale, all the units have to be dimensionally compatible and will be auto-converted to the same unit.
layer1 = data(df) * mapping(:bill_length, color = direct("Bill length")) * visual(Density)
layer2 = data(df) * mapping(:bill_depth, color = direct("Bill depth")) * visual(Density)

draw(layer1 + layer2)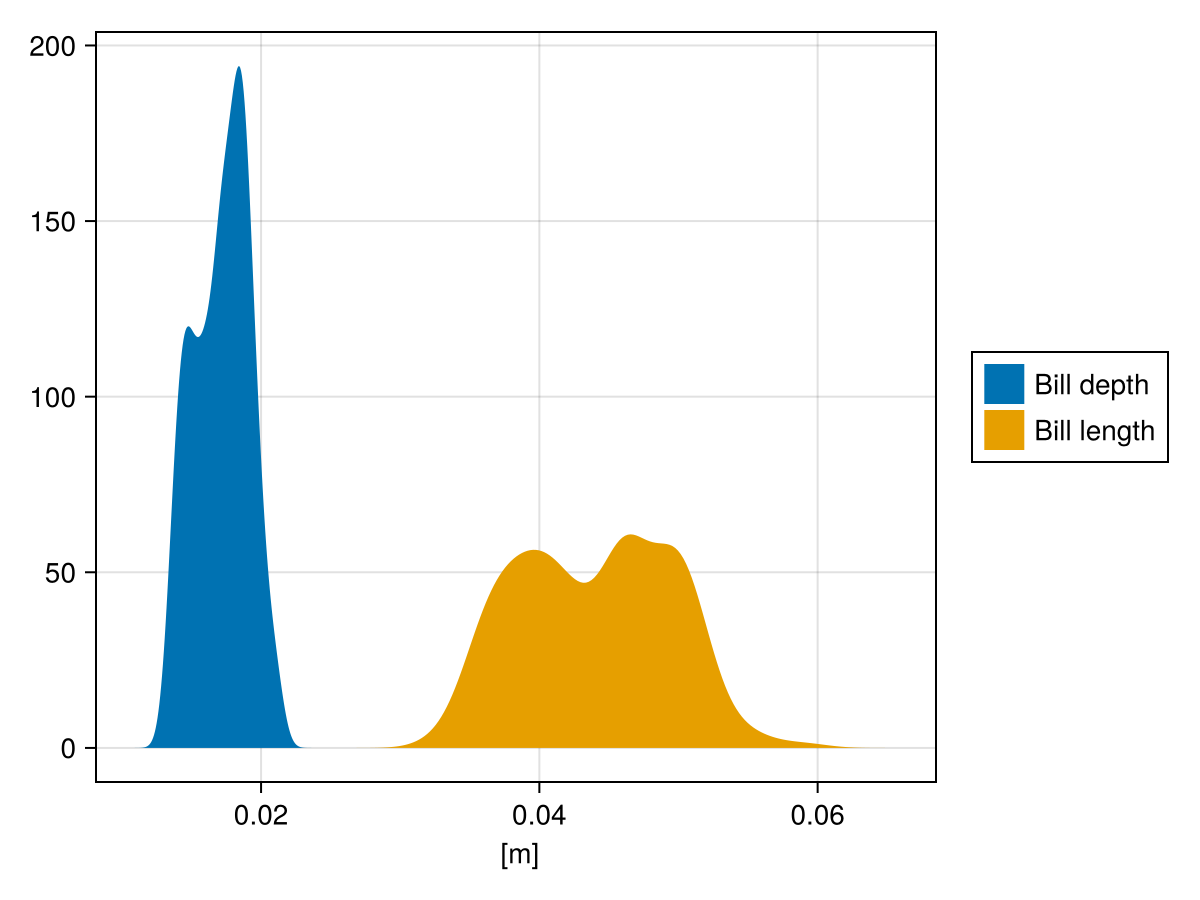
AlgebraOfGraphics will complain if we try to plot dimensionally incompatible units on the same scale:
layer1 = data(df) * mapping(:bill_length, color = direct("Bill length")) * visual(Density)
layer2 = data(df) * mapping(:body_mass, color = direct("Body mass")) * visual(Density)

draw(layer1 + layer2)
┌ Warning: Assignment to `layer1` in soft scope is ambiguous because a global variable by the same name exists: `layer1` will be treated as a new local. Disambiguate by using `local layer1` to suppress this warning or `global layer1` to assign to the existing global variable.
└ @ units.md:72
┌ Warning: Assignment to `layer2` in soft scope is ambiguous because a global variable by the same name exists: `layer2` will be treated as a new local. Disambiguate by using `local layer2` to suppress this warning or `global layer2` to assign to the existing global variable.
└ @ units.md:73
Merging the extrema of two subscales of the continuous scale X failed. This usually happens if two layers are combined which use data of different types for the same scale.
The incompatible extrema of the two scales were (32.1 mm, 59.6 mm) and (2700 g, 6300 g).
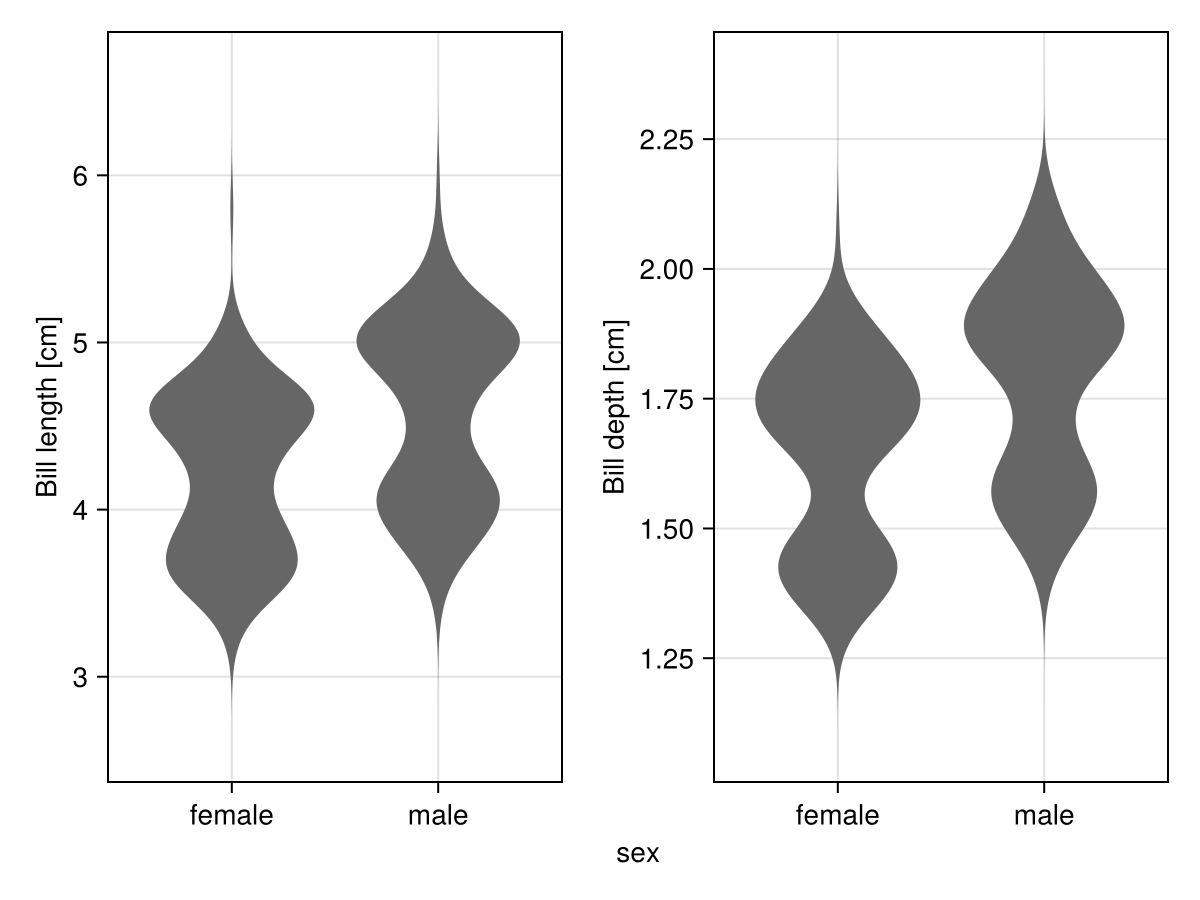
The error was: DimensionError: 2700.0 g and 32.1 mm are not dimensionally compatible.In the next example, we make a facet plot with wide data, and even though there are two y axes, there's just one underlying Y scale being fit. Therefore, both columns get unit-converted:
spec_wide = data(df) *
    mapping(:sex, [:bill_length => "Bill length", :bill_depth => "Bill depth"], layout = dims(1)) *
    visual(Violin)

draw(spec_wide)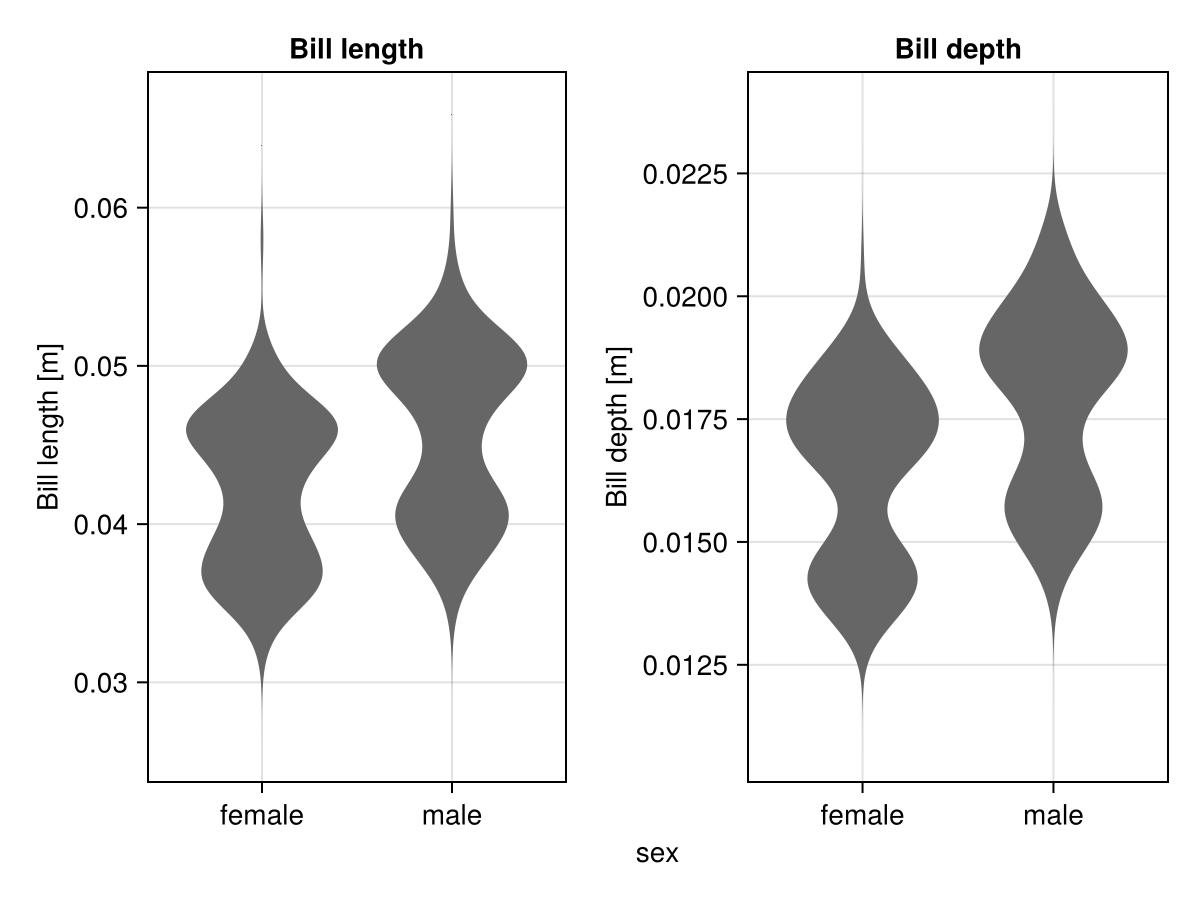
Again, we can force a different display unit via the scale options.
draw(spec_wide, scales(Y = (; unit = u"cm"), Layout = (; legend = false)))