Faceting
using AlgebraOfGraphics, CairoMakieFacet grid
df = let
    N = 100
    x0 = rand(1:10, N)
    i = rand(["α", "β"], N)
    j = rand(["a", "b", "c"], N)

    x = map(zip(x0, j)) do (xx, jj)
        shift = jj == "a" ? -2.9 : jj == "c" ? 2.9 : 0.0
        xx + shift
    end

    y = map(zip(x0, i)) do (xx, ii)
        shift = ii == "α" ? -3.9 : 3.9
        xx + 2 + shift + rand()
    end

    (; x, y, i, j)
end

plt = data(df) * mapping(:x, :y, row=:i, col=:j)

draw(plt)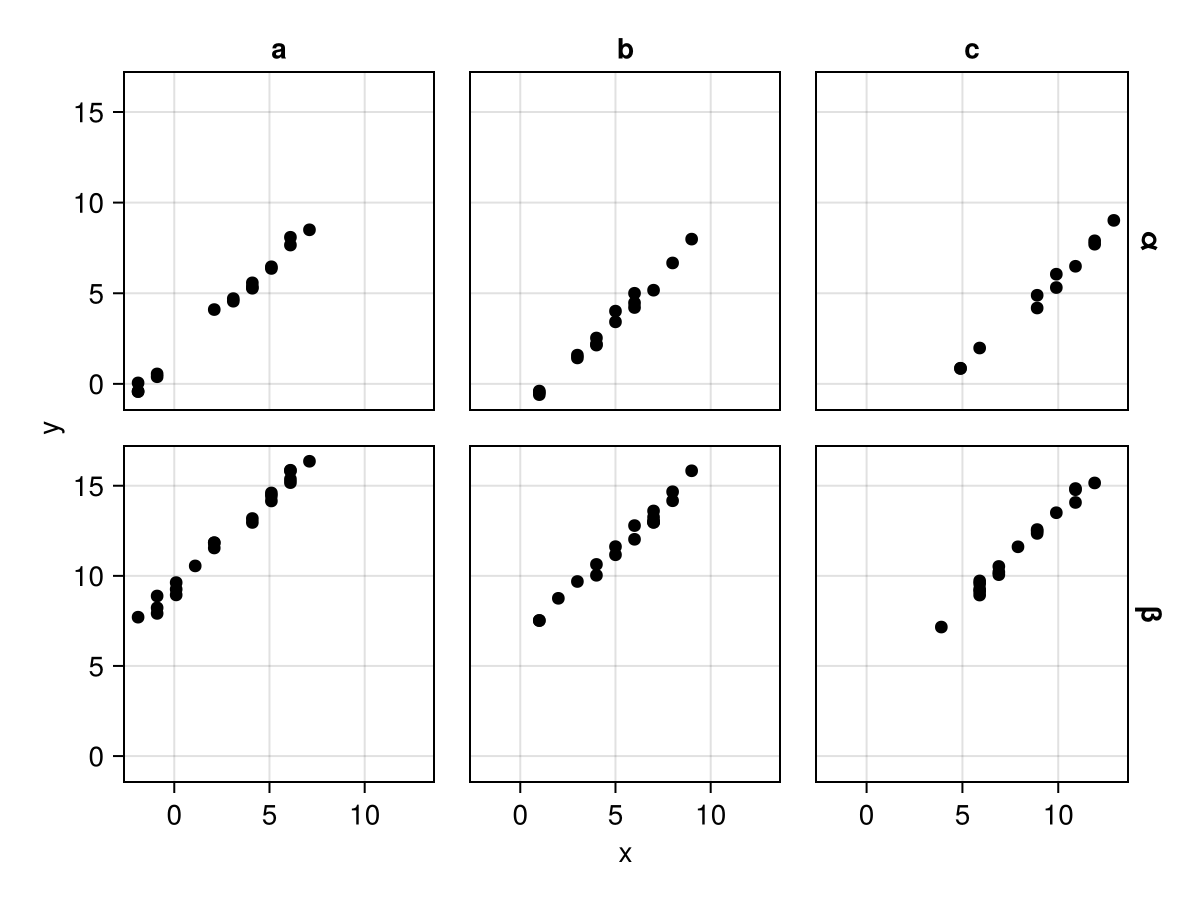
Facet grid with minimal axes linking needed to remove ticks
draw(plt, facet=(; linkxaxes=:minimal, linkyaxes=:minimal))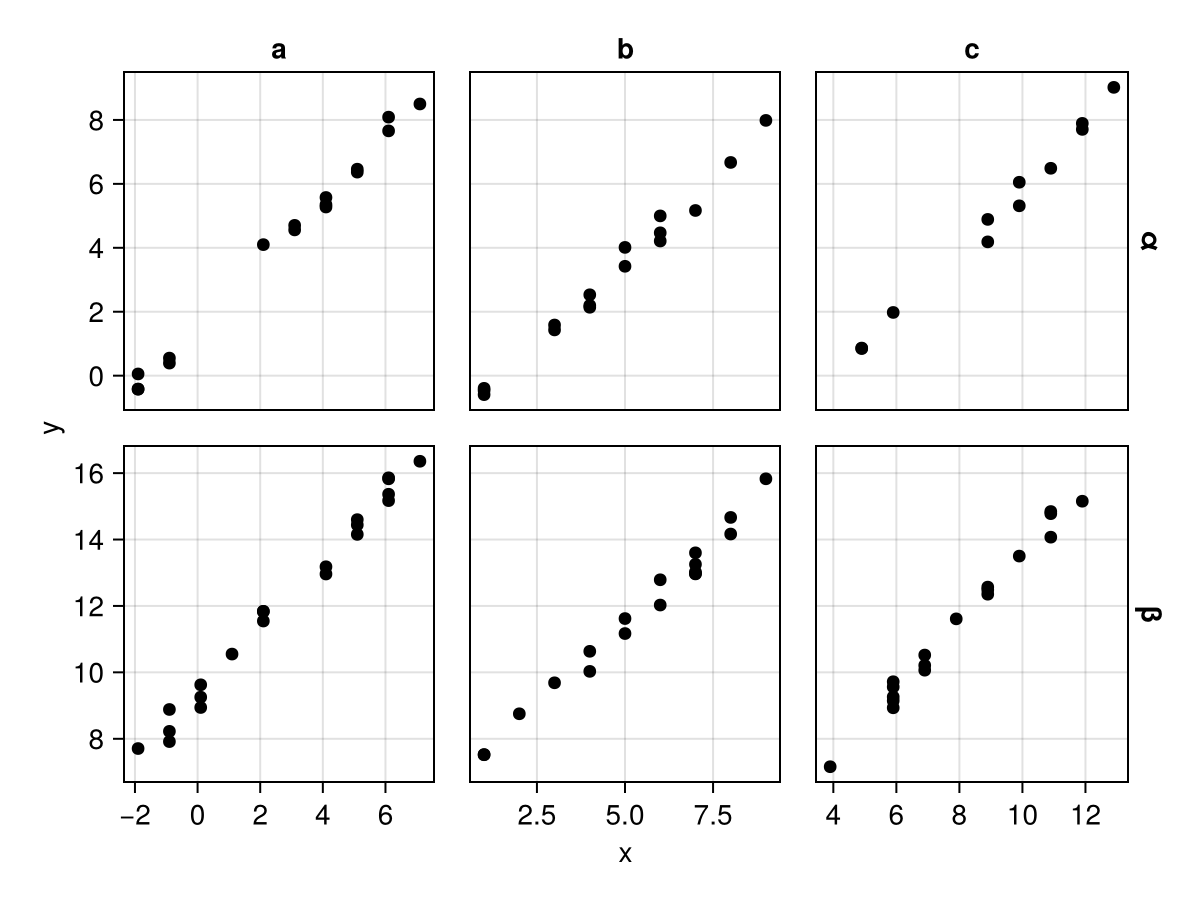
Facet grid with unlinked x-axes
draw(plt, facet=(; linkxaxes=:none))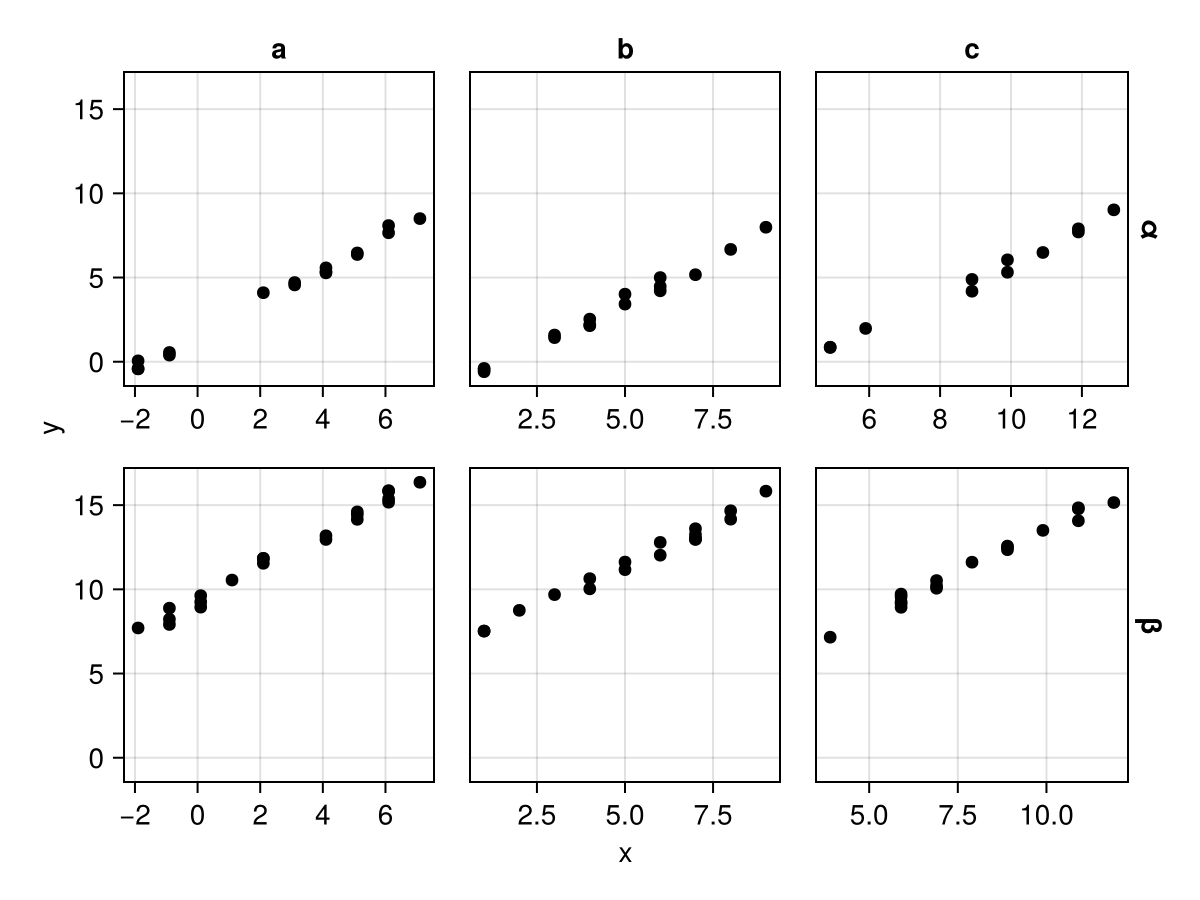
Facet wrap
df = (x=rand(100), y=rand(100), l=rand(["a", "b", "c", "d", "e"], 100))
plt = data(df) * mapping(:x, :y, layout=:l)
draw(plt)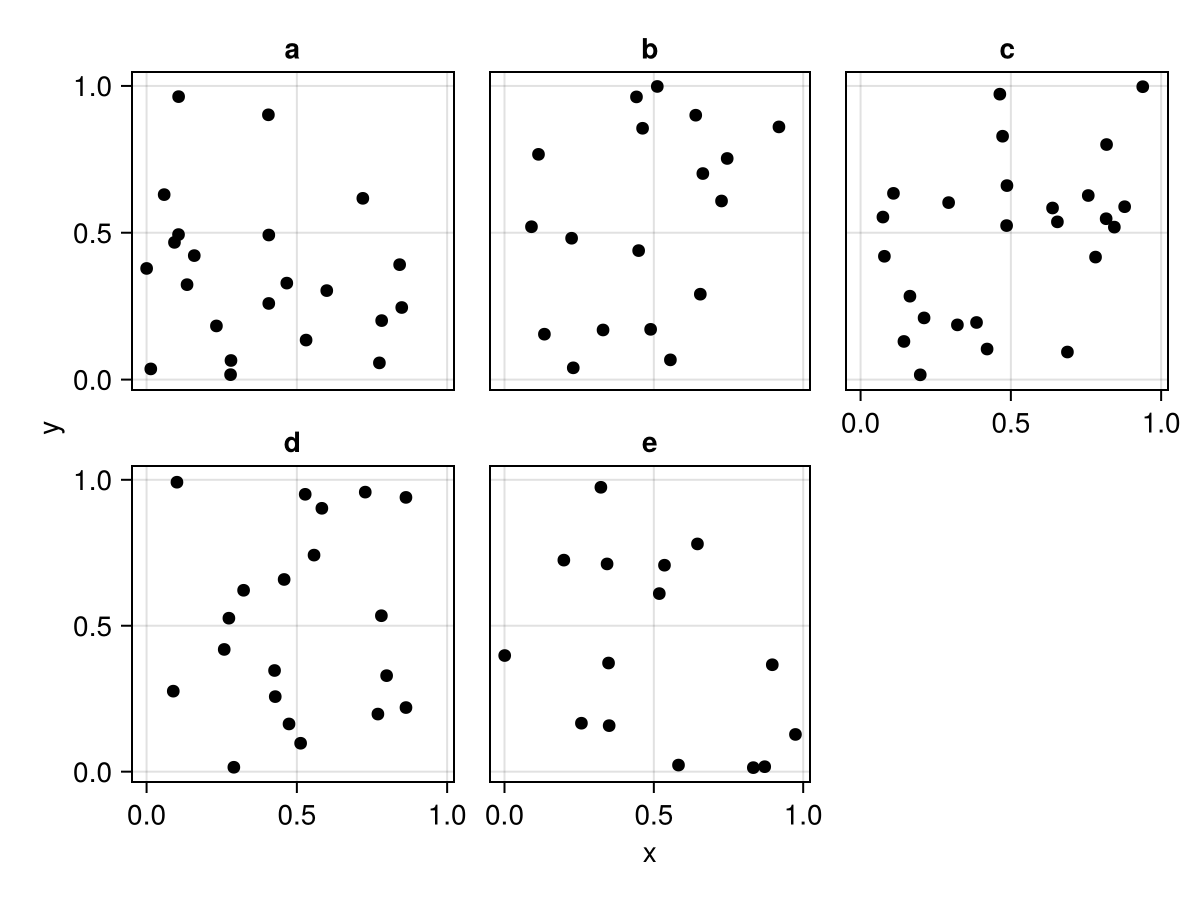
Facet wrap with unlinked axes
draw(plt, facet=(; linkxaxes=:none, linkyaxes=:none))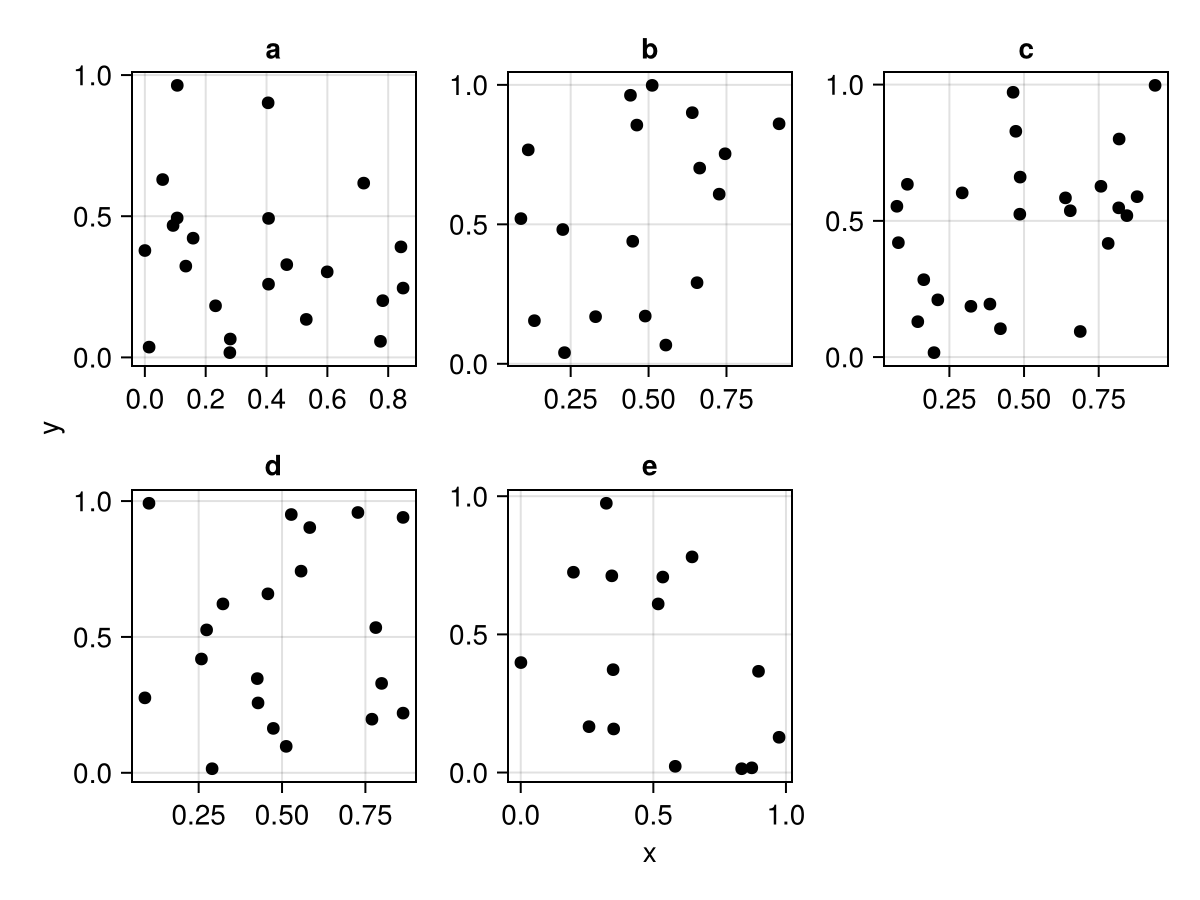
Facet wrap with specified layout for rows and cols
draw(plt, scales(Layout = (; palette = [(1, 1), (2, 1), (3, 1), (1, 2), (2, 2)])))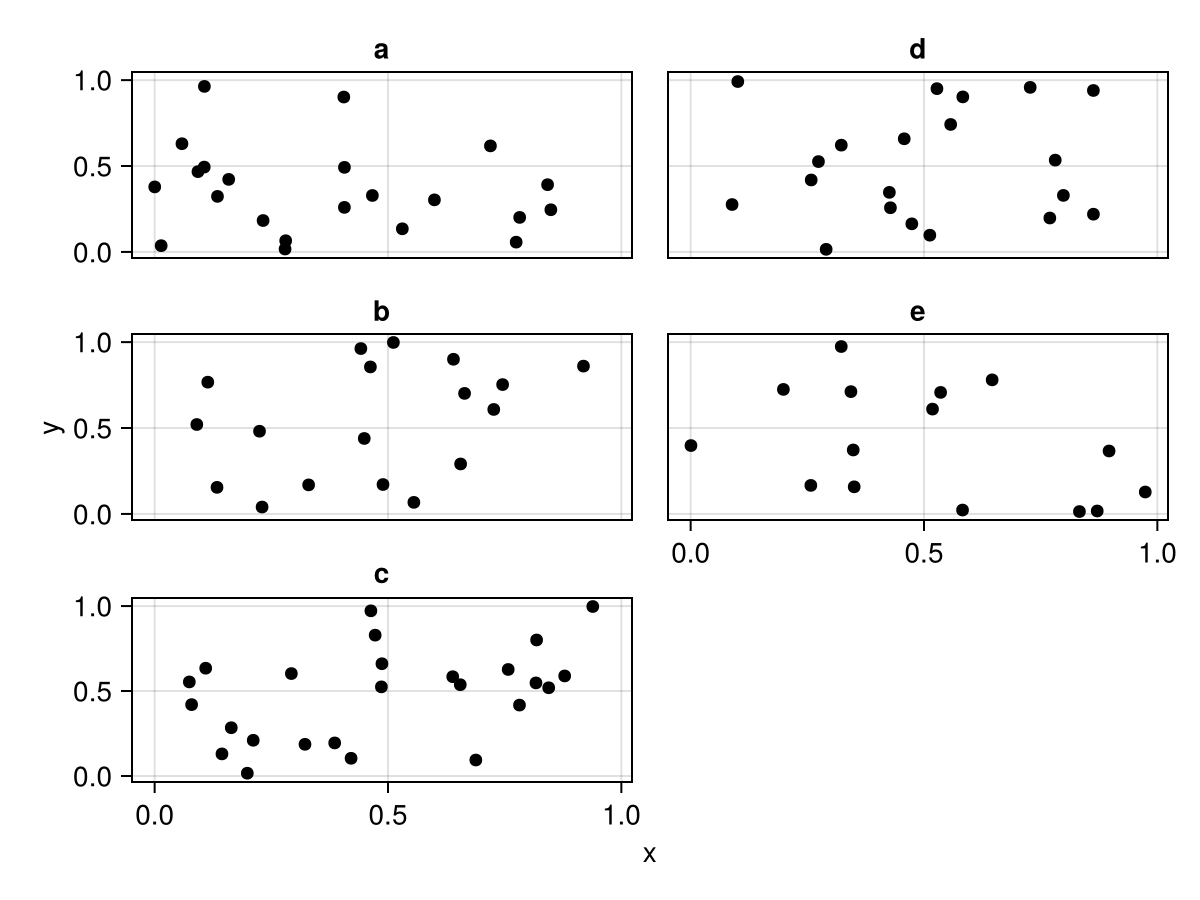
Sizing facets
By default, all facets share the figure size that Makie picks for Figure. With many facets that's often too cramped: axes get squeezed, labels overlap, and the figure can't grow because no axis has an explicit width/height.
You can pass a per-axis width and height directly via axis = (; width, height), in which case the figure will resize to fit:
draw(plt; axis = (; width = 100, height = 100))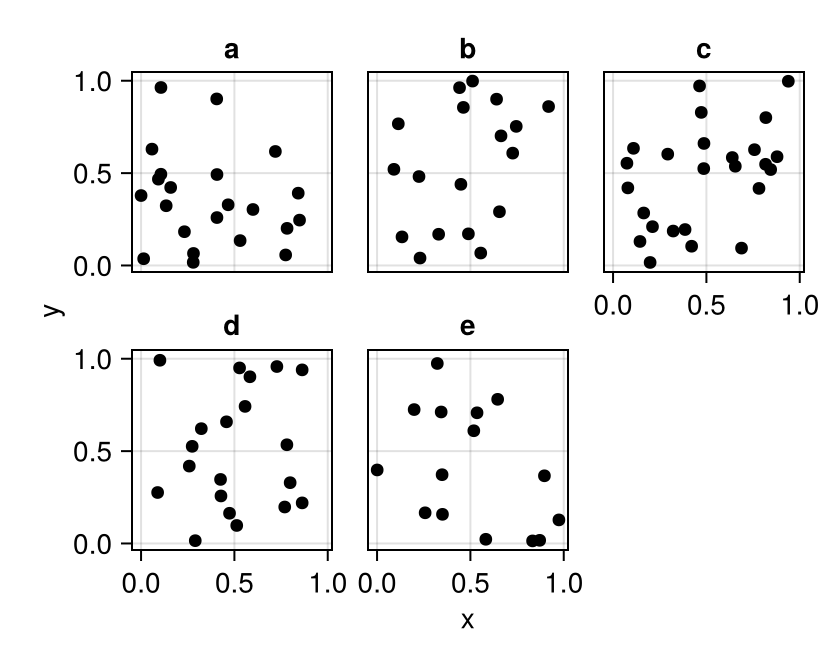
Often, though, the right size depends on how many facets there are. For that, AoG provides FacetSize:
fs = FacetSize(1.0, (n_rows, n_cols) -> max(n_rows, n_cols) <= 2 ? 200 : 100)
draw(plt; facet = (; size = fs))
FacetSize(aspect, height_fn) packages two pieces of information:
aspect(axis width / height) — used upfront when computing the wrap layout, so wide axes get fewer columns and tall axes get more (see Aspect-aware wrap below).height_fn(n_rows, n_cols) -> Int— runs after the grid is determined and returns the per-axis height. Width is derived asaspect * height.
This lets you write a single sizing policy that adapts to the data. The example above gives a 200×200 axis when there are at most 2 rows or columns, and shrinks to 100×100 for larger grids.
You can still override width or height (or both) via axis. If you supply only one dimension, the other is derived from FacetSize's aspect; if you supply both, your aspect takes over (and the height_fn is ignored):
draw(plt; facet = (; size = fs), axis = (; width = 200))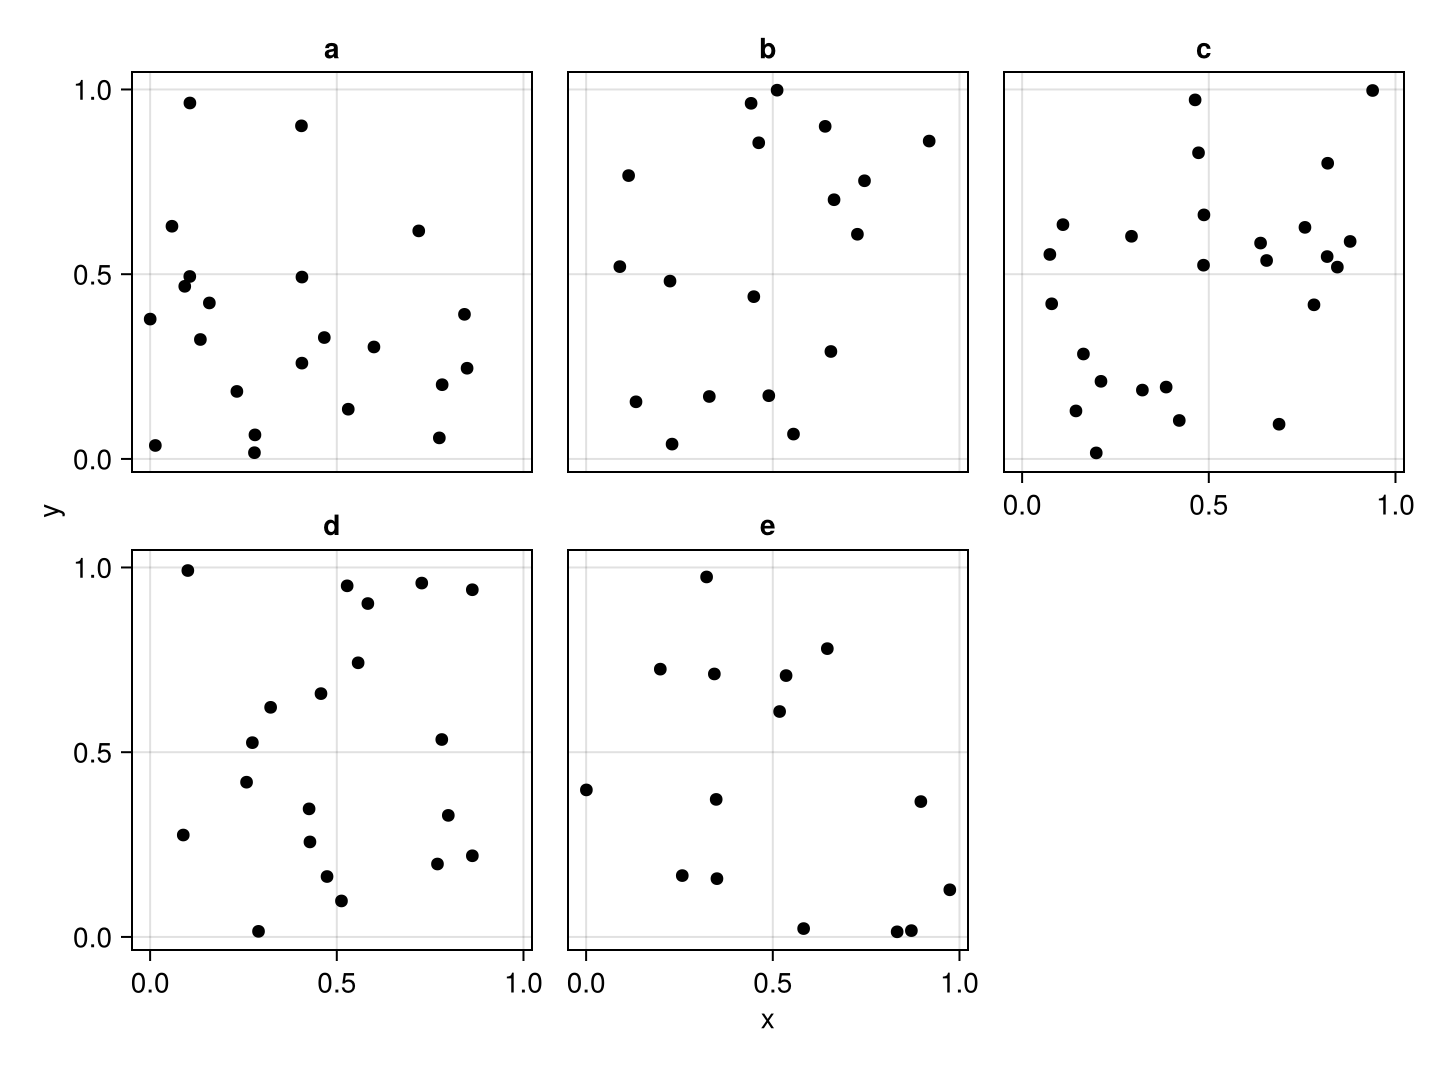
Aspect-aware wrap
When wrapped() is the default Layout palette (i.e. you don't pass cols, rows, or a custom palette), the row/column distribution is decided at draw time using the effective axis aspect ratio. The aspect comes from FacetSize if provided, otherwise from axis = (; width, height) if both are given, otherwise it defaults to 1.0 — which reproduces the prior squareish wrap (ceil(sqrt(n)) columns).
For non-square axes, the wrap picks a column count that brings the bunched axis areas closest to a square shape. With the same 5 facets above, wide axes prefer fewer columns:
draw(plt; facet = (; size = FacetSize(2.0, (nr, nc) -> 100)))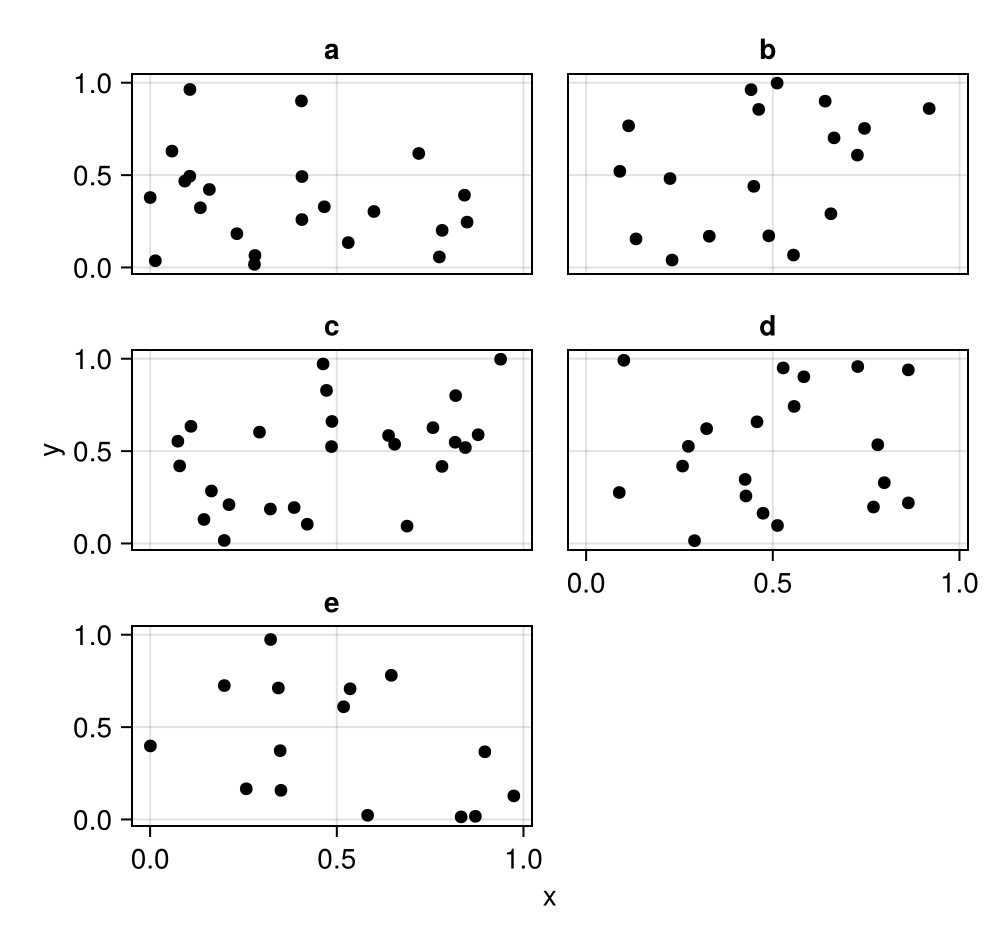
and tall axes prefer more columns:
draw(plt; facet = (; size = FacetSize(0.5, (nr, nc) -> 200)))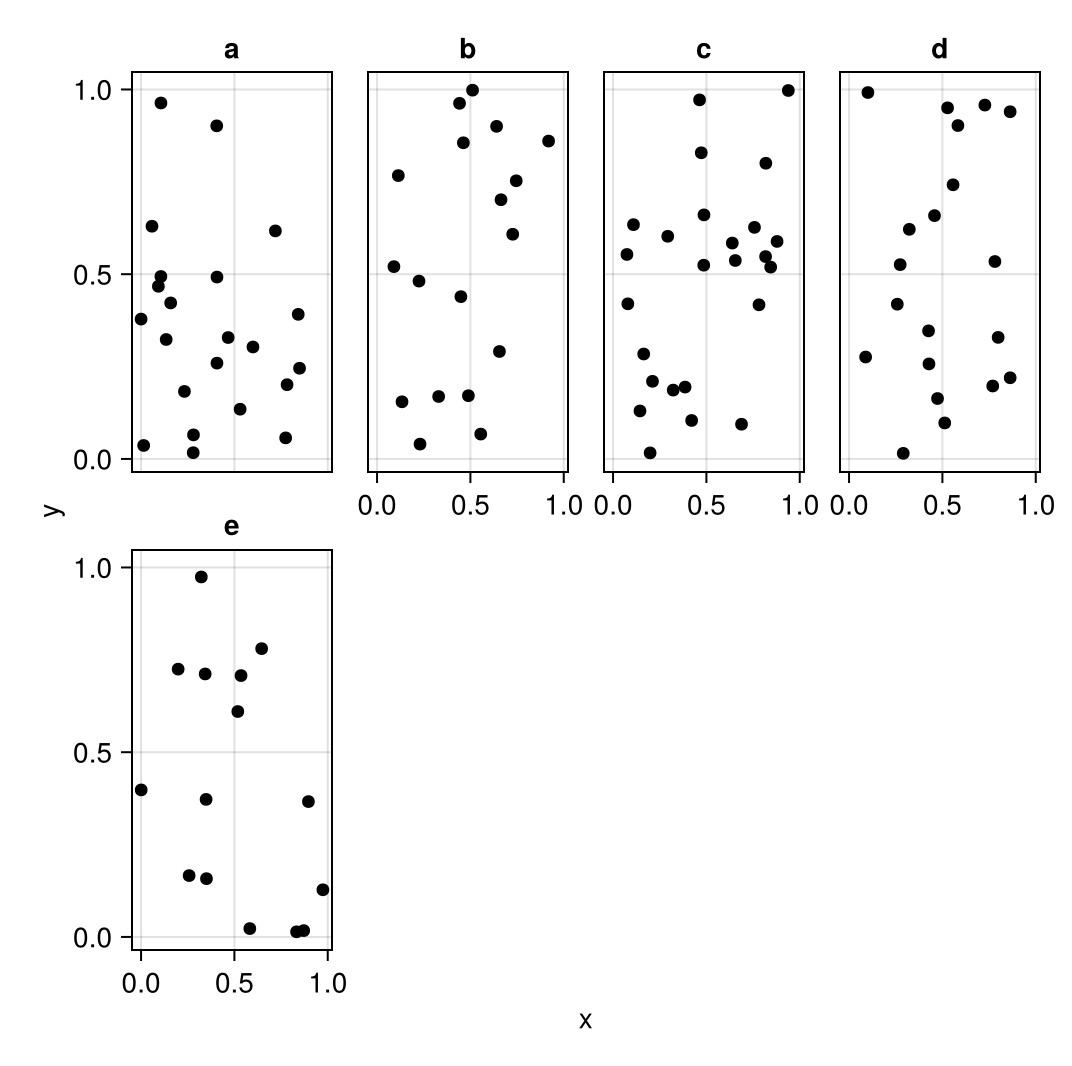
Adding traces to only some subplots
df1 = (x=rand(100), y=rand(100), i=rand(["a", "b", "c"], 100), j=rand(["d", "e", "f"], 100))
df2 = (x=[0, 1], y=[0.5, 0.5], i=fill("a", 2), j=fill("e", 2))
layers = data(df1) * visual(Scatter) + data(df2) * visual(Lines)
fg = draw(layers * mapping(:x, :y, col=:i, row=:j))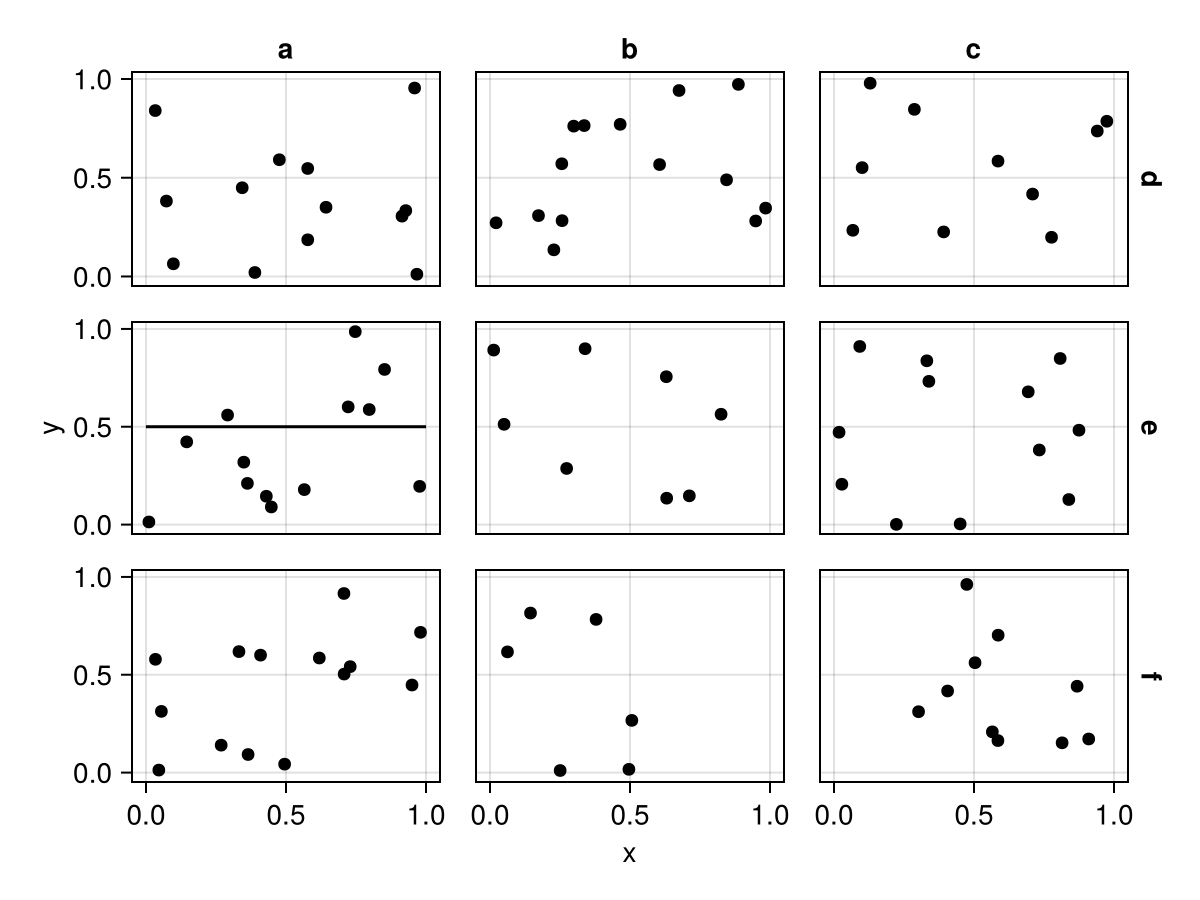
Caveats
The faceting variable must be non-numeric. If the source is numeric, you can convert it with nonnumeric.
df = (x=rand(100), y=rand(100), l=rand([1, 2, 3, 4, 5], 100))
plt = data(df) * mapping(:x, :y, layout=:l => nonnumeric)
draw(plt)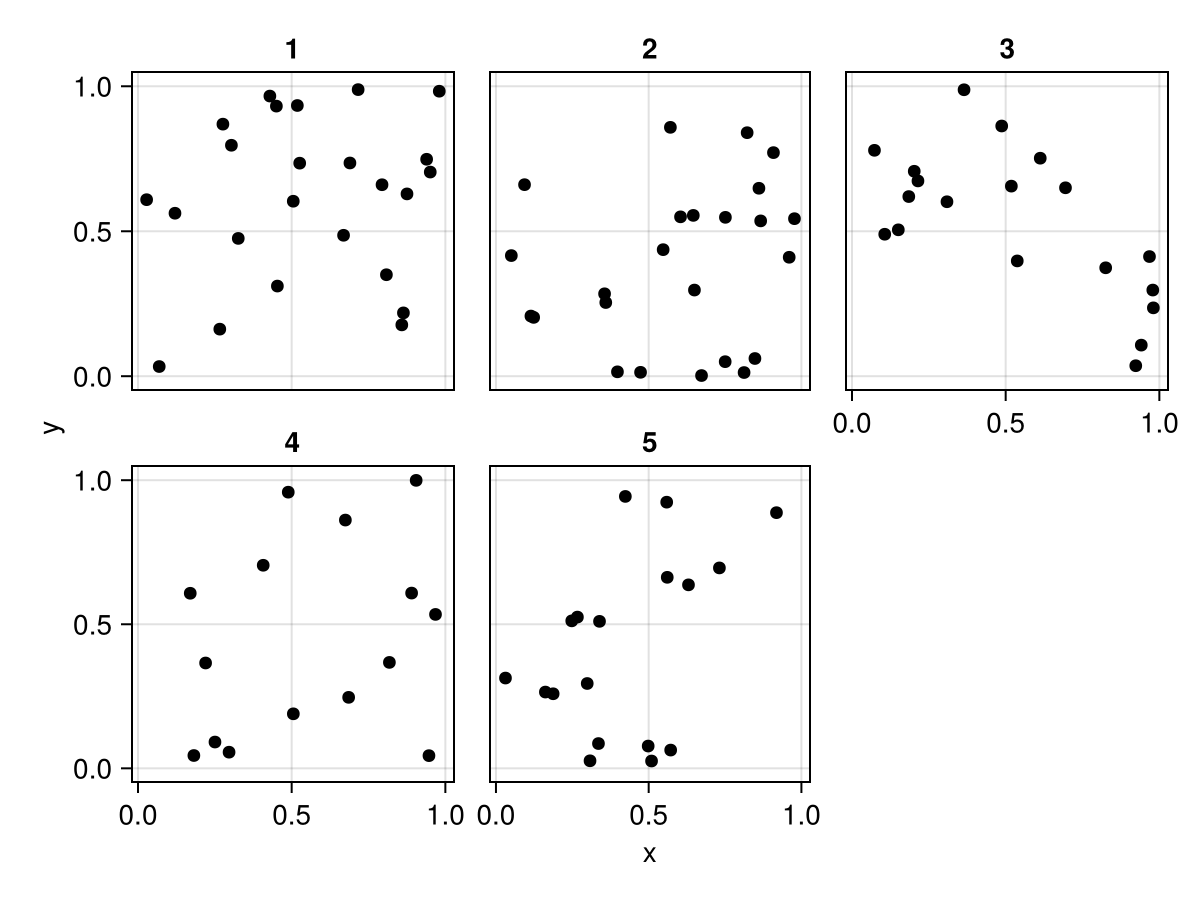
Pagination
If you have too many facets for one figure, you can use paginate to split the data into several subsets given a maximum number of plots per layout, row or column.
We start with a normal facet plot, in this case a wrapped layout:
df = (
    x = repeat(1:10, 36),
    y = cumsum(sin.(range(0, 10pi, 360))),
    group = repeat(string.("Group ", 1:36), inner = 10),
    color = 1:360,
)
plt = data(df) * mapping(:x, :y, color = :color, layout=:group) * visual(Lines)
draw(plt)
Scales are synchronized across pages. Note, however, that linked axis limits are currently not synchronized across pages. The exact synchronization behavior may be subject to change in non-breaking versions.
pag = paginate(plt, layout = 9)Pagination with 4 entries (layout = 9)The object returned from draw will be a Vector{FigureGrid}.
figuregrids = draw(pag)4-element Vector{AlgebraOfGraphics.FigureGrid}:
FigureGrid()
FigureGrid()
FigureGrid()
FigureGrid()You can either extract single figures from this vector...
figuregrids[1]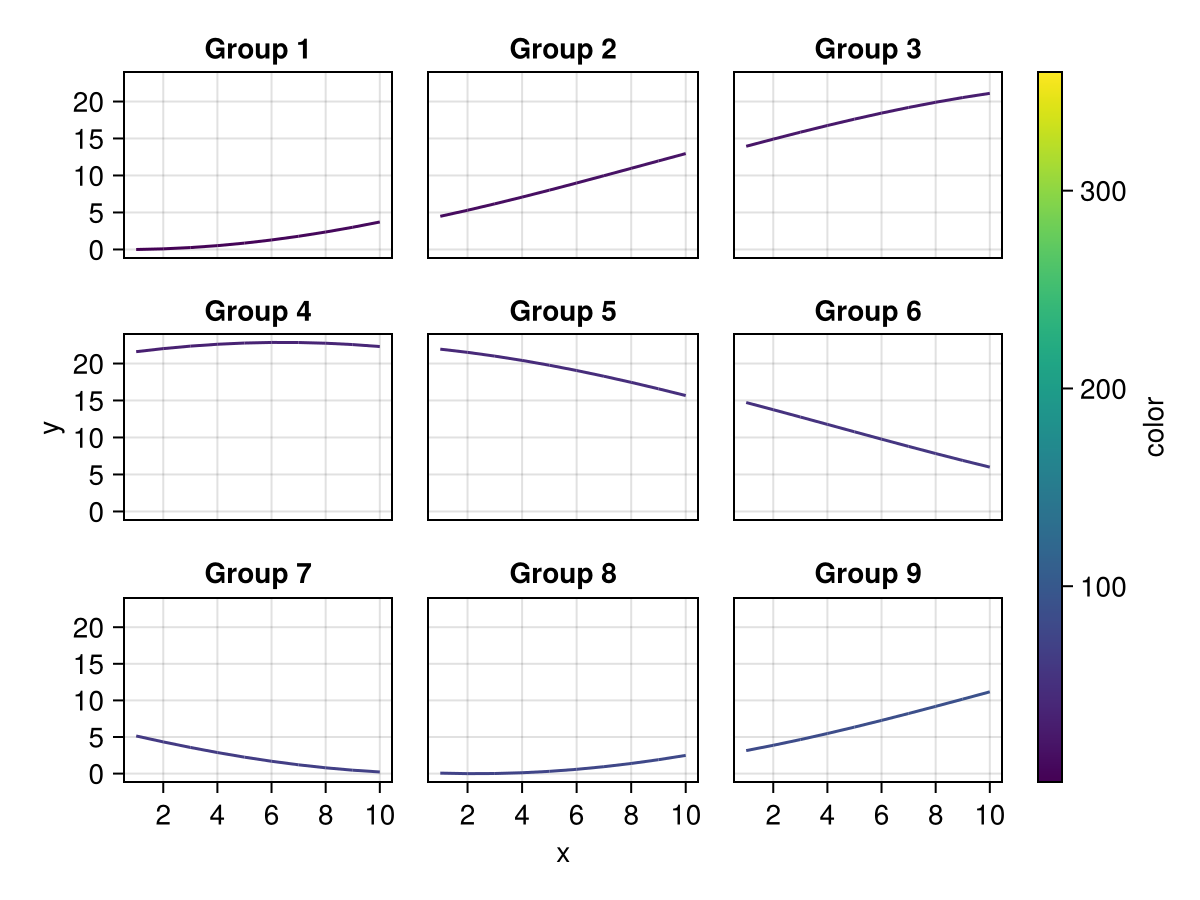
or use draw with an optional second argument specifying the index of the page to draw.
draw(pag, 4)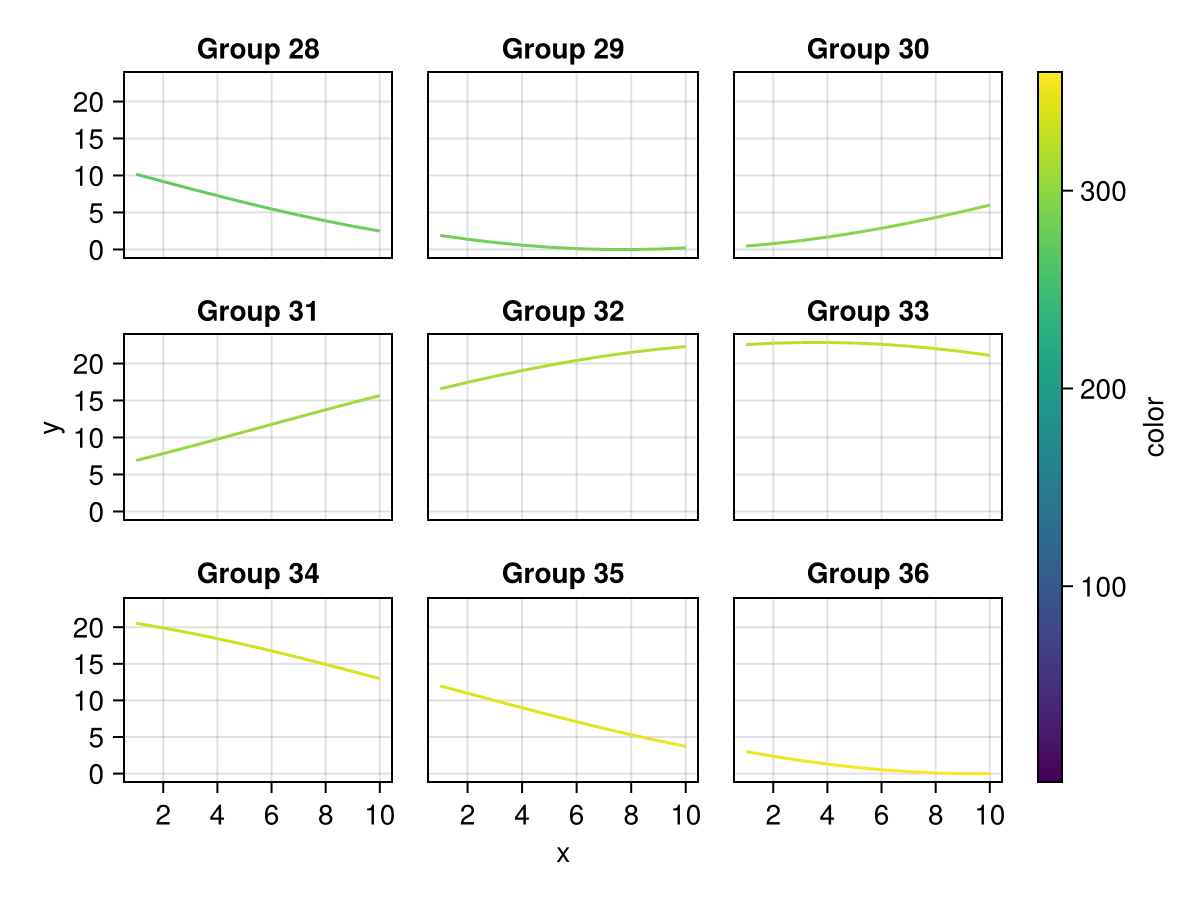
Controlling rows and columns per page
By default, pagination with a Layout scale (wrapped layout) uses a squarish arrangement on each page. If you want a specific number of rows and columns per page, combine a wrapped palette on the Layout scale with the appropriate layout limit.
For example, to get pages with 2 columns and 3 rows, set layout = 2 * 3 and palette = wrapped(cols = 2):
pag_2x3 = paginate(
    plt,
    scales(Layout = (; palette = wrapped(cols = 2))),
    layout = 2 * 3,
)
draw(pag_2x3, 1)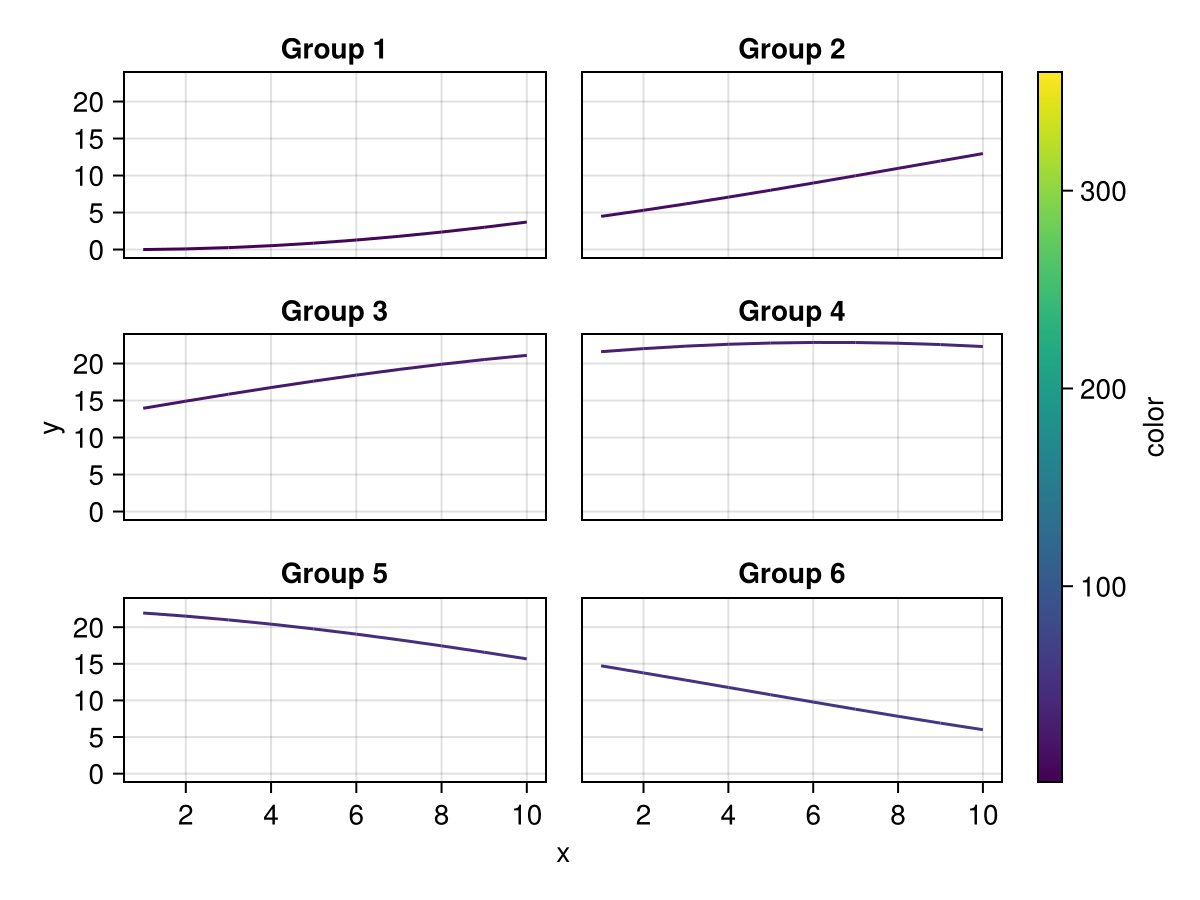
Compare this to the default wrapping, which for 6 items would produce a 2×3 (rows×cols) layout instead:
pag_default = paginate(plt, layout = 6)
draw(pag_default, 1)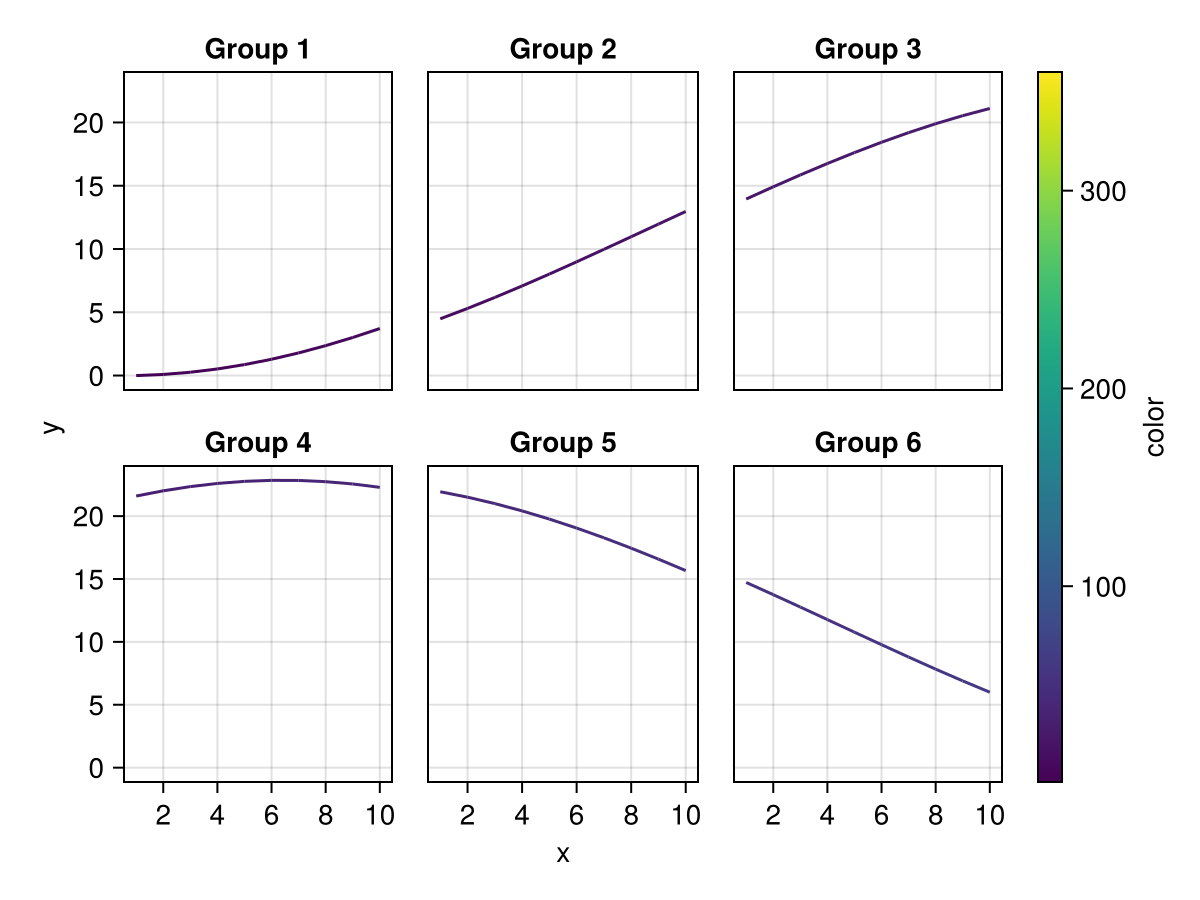
Legend entries per page
By default, the legend on each page only shows categories that are present on that page. This is controlled by the hide_unused legend option which defaults to true.
df_color = (
x = repeat(1:5, 8),
y = reduce(vcat, [sin.(i .+ (1:5)) .+ offset for i in 1:4 for offset in [-1, 1]]),
color = repeat(["X", "Y", "X", "Y", "Y", "Z", "Y", "Z"], inner = 5),
layout = repeat(["A", "B", "C", "D"], inner = 10),
)
plt_color = data(df_color) * mapping(:x, :y, color = :color, layout = :layout) * visual(ScatterLines)
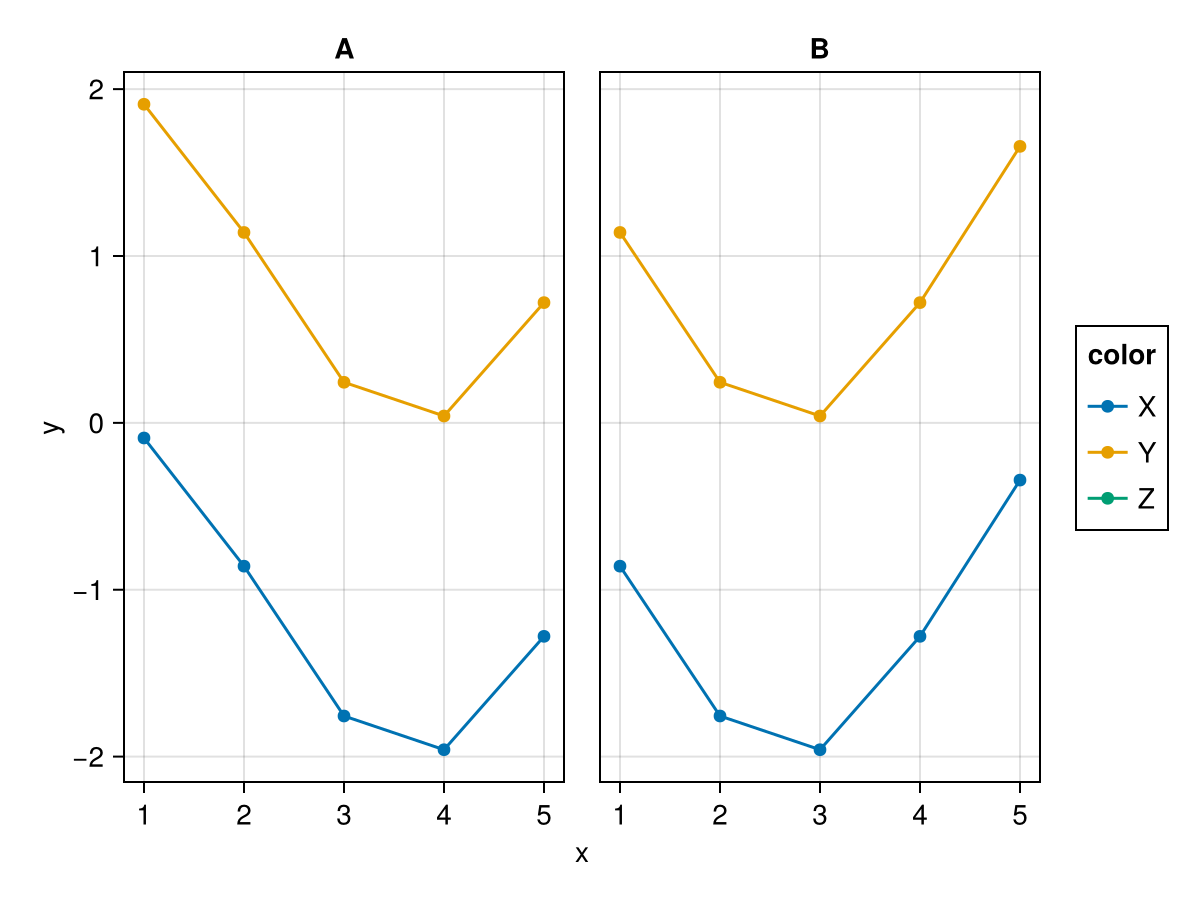
pag_color = paginate(plt_color, layout = 2)Pagination with 2 entries (layout = 2)Page 1 (panels A, B) only has colors X and Y:
draw(pag_color, 1)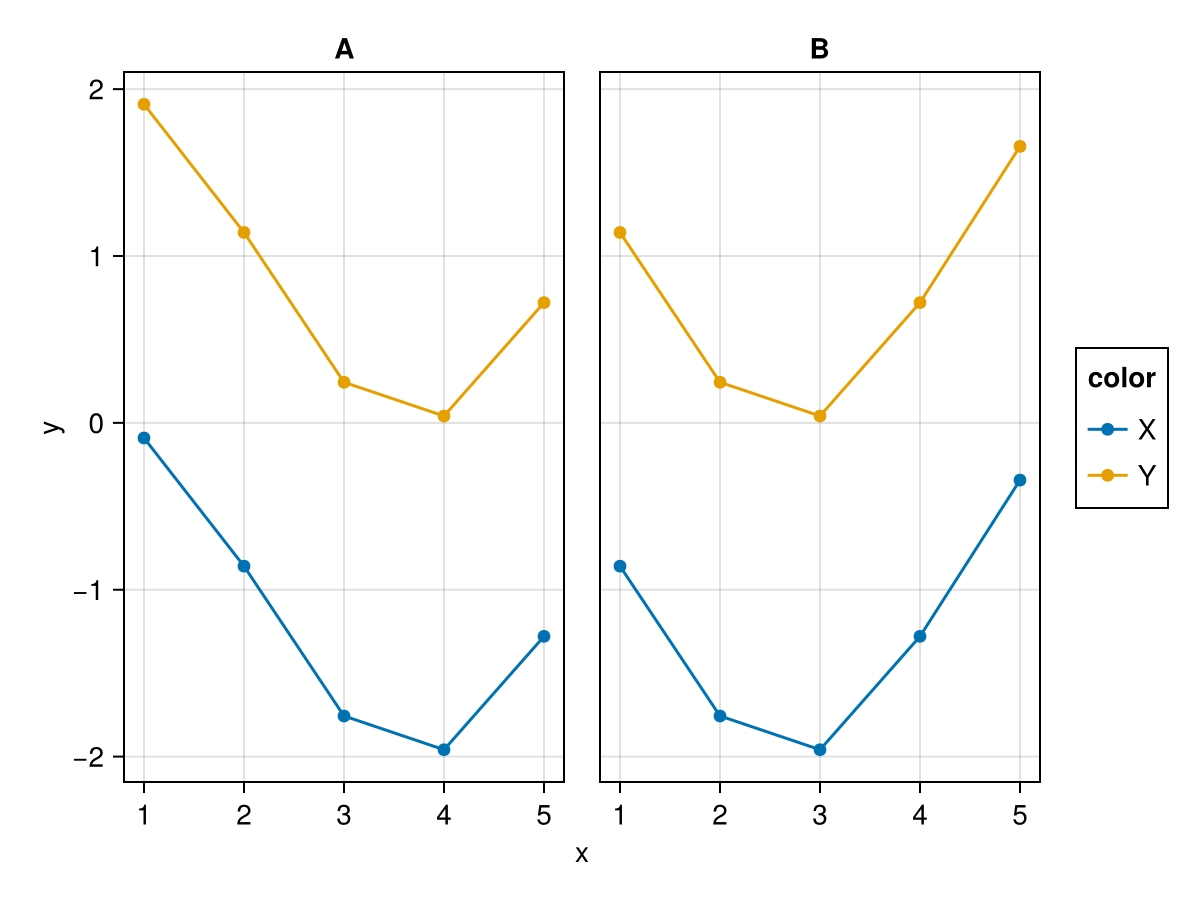
Page 2 (panels C, D) only has colors Y and Z:
draw(pag_color, 2)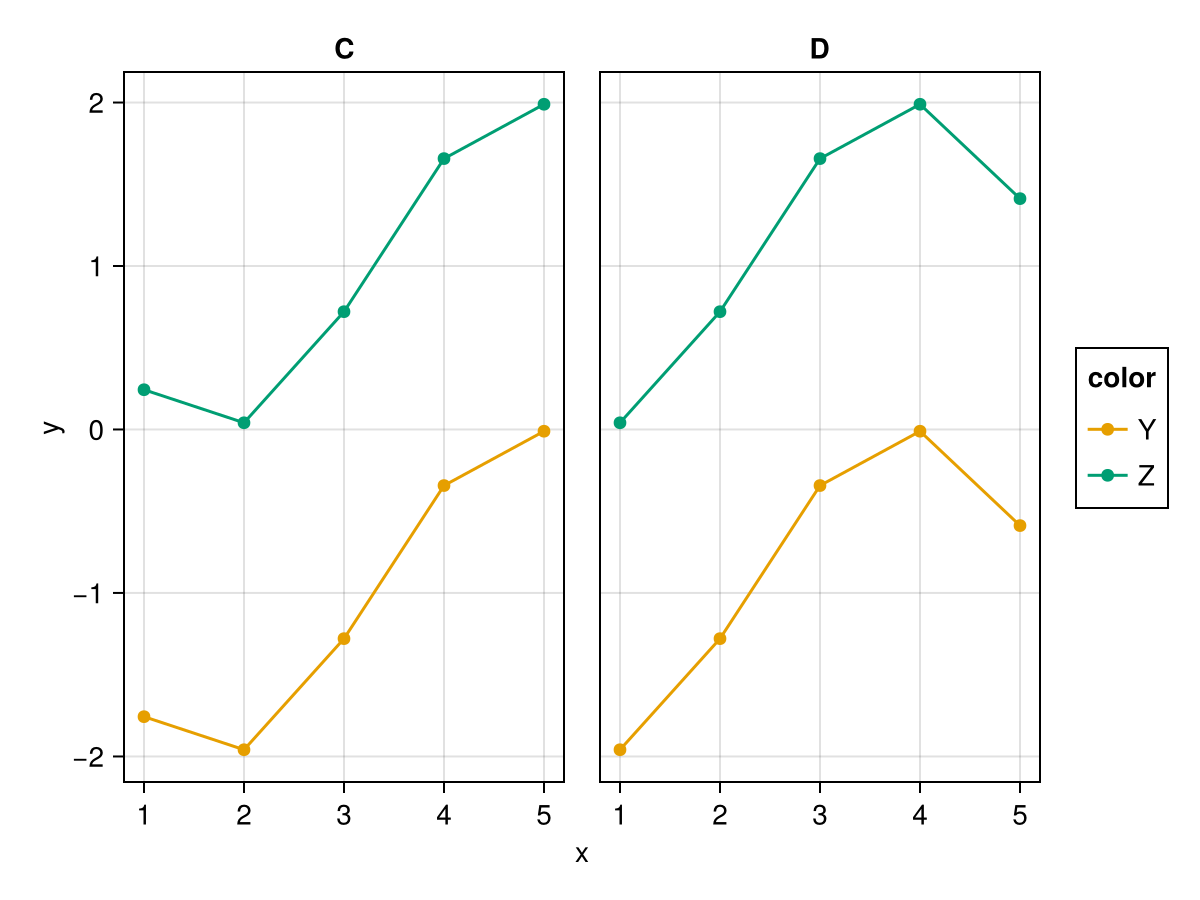
Setting hide_unused = false shows all categories on every page, which keeps legends consistent across pages:
draw(pag_color, 1; legend = (; hide_unused = false))