Dodging
using AlgebraOfGraphics, CairoMakie
using Colors
Some plot types like barplots natively support a dodge attribute which avoids overlap between groups that share the same coordinates.
df = (; x = ["One", "One", "Two", "Two"], y = 1:4, err = [0.2, 0.3, 0.4, 0.5], group = ["A", "B", "A", "B"])
plt = data(df) * mapping(:x, :y, dodge = :group, color = :group) * visual(BarPlot)
draw(plt)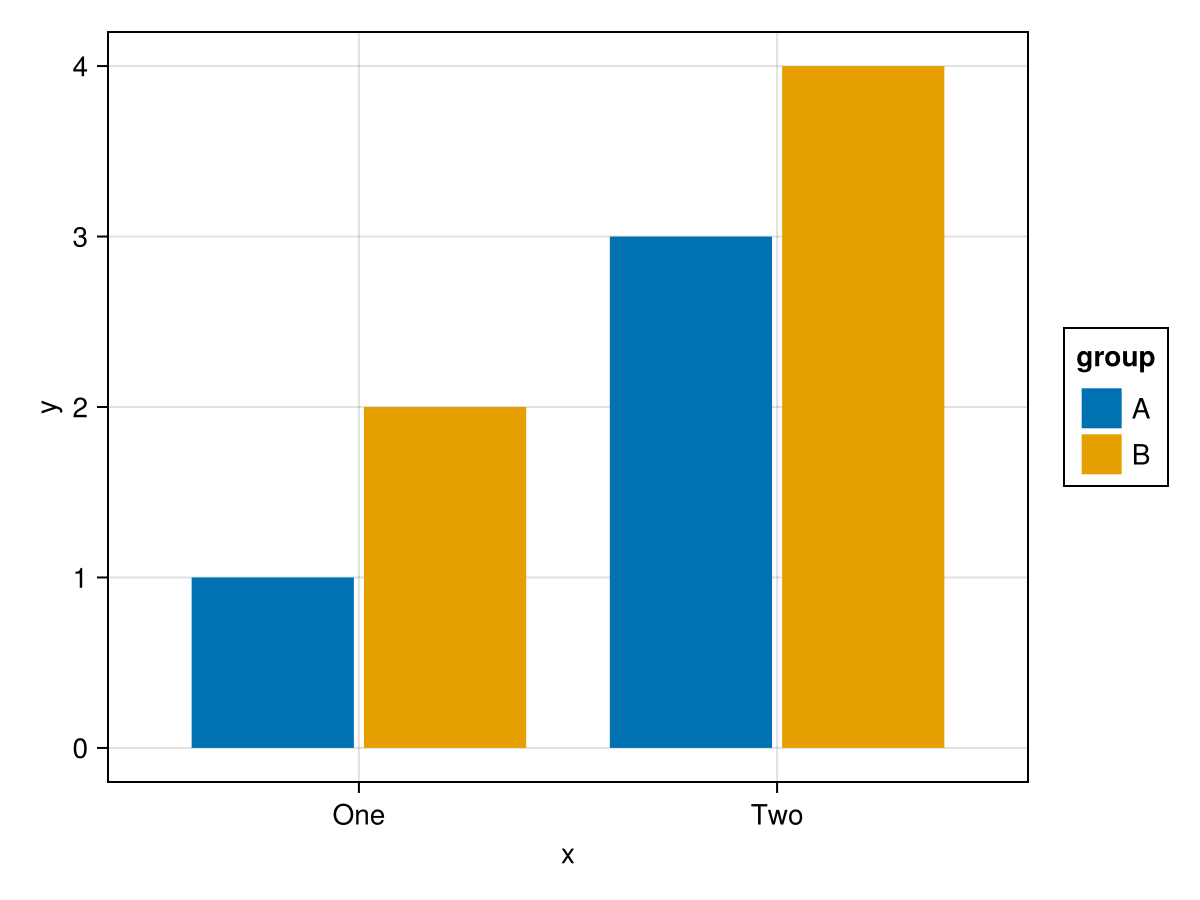
You can also use the generic dodge_x or dodge_y mappings instead of dodge. On plot types that have a native :dodge attribute (BarPlot, BoxPlot, Violin, CrossBar), the generic form is automatically routed to the native one when the direction matches (e.g. dodge_x on a vertical barplot), so the bars are narrowed just as with dodge.
plt = data(df) * mapping(:x, :y, dodge_x = :group, color = :group) * visual(BarPlot)
draw(plt)
The advantage of dodge_x/dodge_y is that they work on any plot type, including "width-less" ones like Scatter or Errorbars that have no native :dodge. This makes it easy to share one mapping across layers that mix plot types. When combined with a plot type that has an inherent width, AlgebraOfGraphics applies that width to the width-less layers automatically so they match:
shared = mapping(:x, :y, dodge_x = :group)
plt = data(df) * (
    shared * mapping(color = :group) * visual(BarPlot) +
    shared * mapping(:err, group = :group) * visual(Errorbars)
)
draw(plt)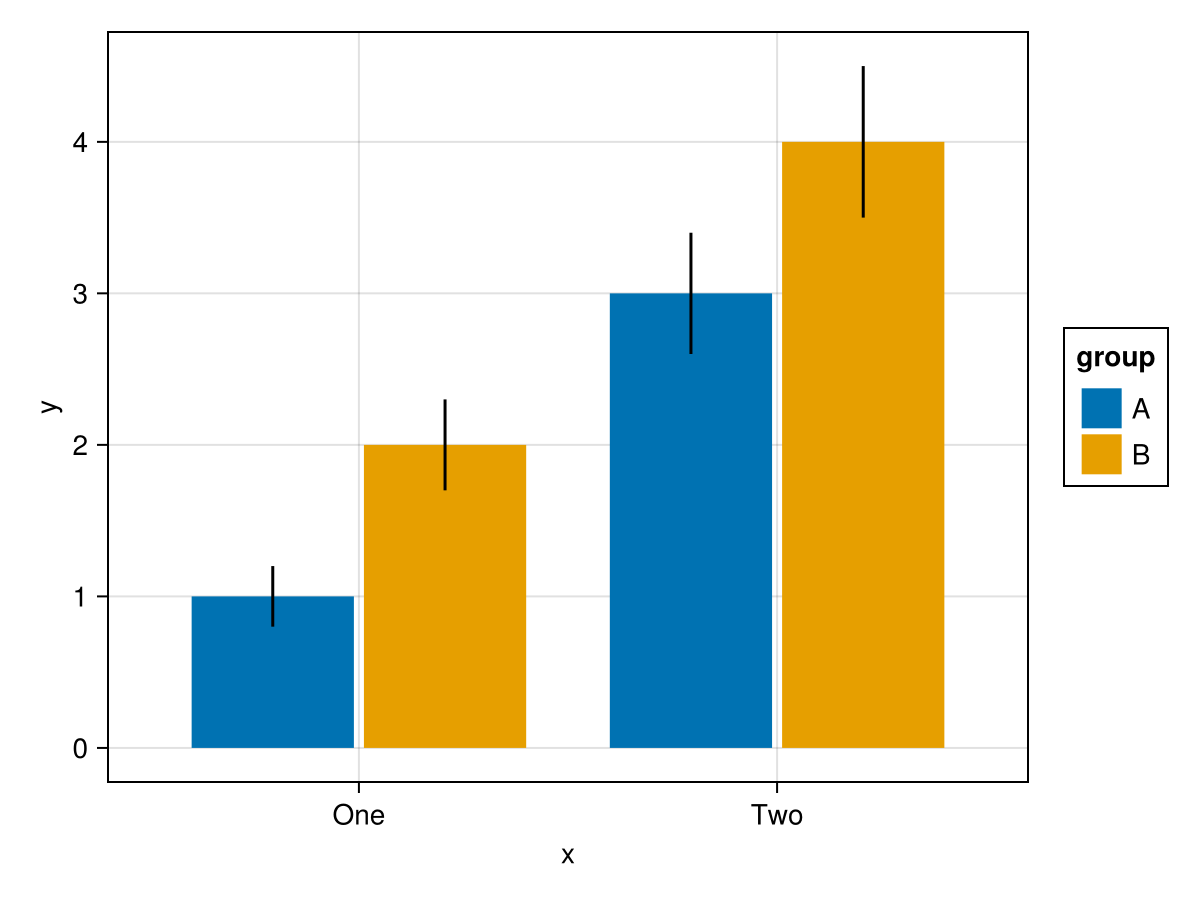
Note
Passing both dodge and dodge_x/dodge_y on the same layer is an error.
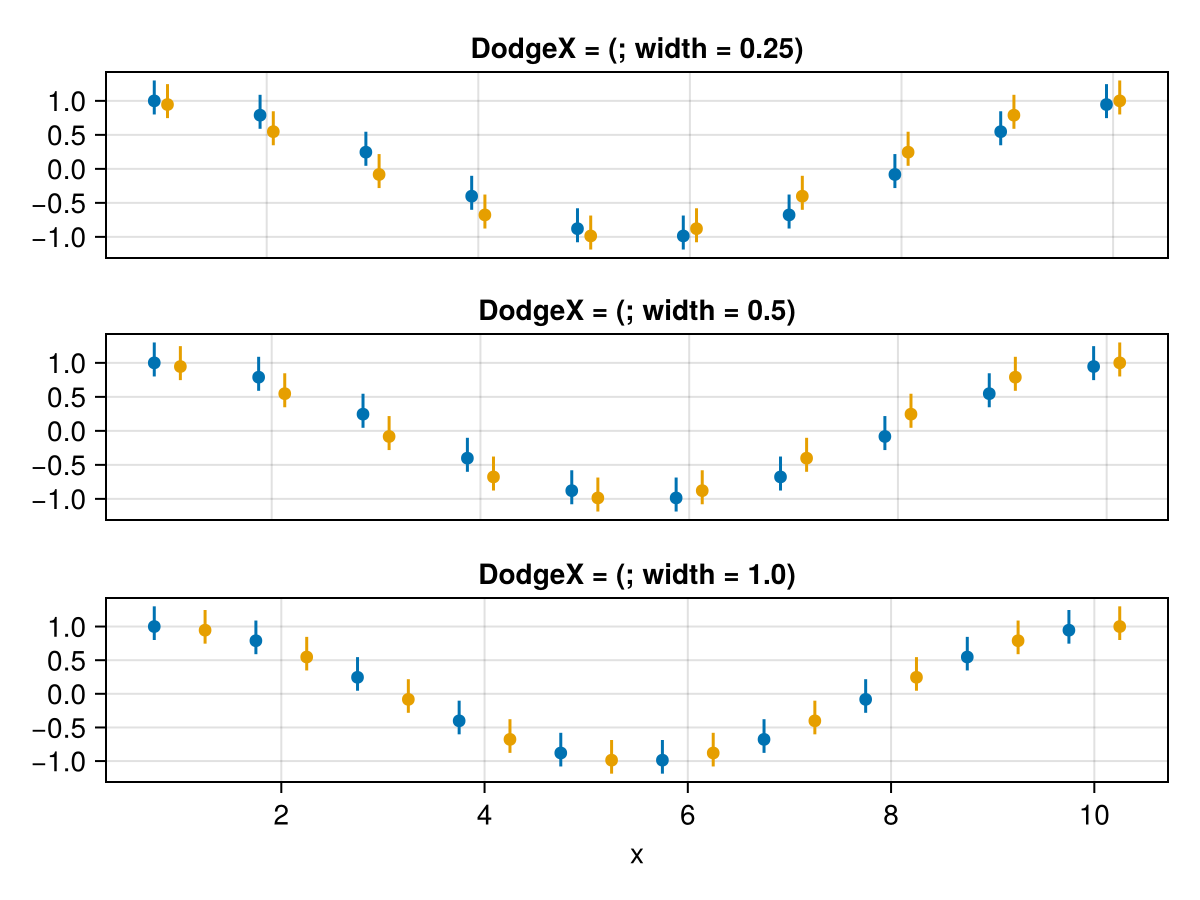
If you only use width-less plot types, you will get an error if you don't set a dodge width manually. You can do so via the scales function:
df2 = (
    x = repeat(1:10, inner = 2),
    y = cos.(range(0, 2pi, length = 20)),
    ylow = cos.(range(0, 2pi, length = 20)) .- 0.2,
    yhigh = cos.(range(0, 2pi, length = 20)) .+ 0.3,
    dodge = repeat(["A", "B"], 10)
)

f = Figure()
plt3 = data(df2) * (
    mapping(:x, :y, dodge_x = :dodge, color = :dodge) * visual(Scatter) +
    mapping(:x, :ylow, :yhigh, dodge_x = :dodge, color = :dodge) * visual(Rangebars)
)
kw(; kwargs...) = (; xticklabelsvisible = false, xticksvisible = false, xlabelvisible = false, kwargs...)

draw!(f[1, 1], plt3, scales(DodgeX = (; width = 0.25)); axis = kw(title = "DodgeX = (; width = 0.25)"))
draw!(f[2, 1], plt3, scales(DodgeX = (; width = 0.5)); axis = kw(title = "DodgeX = (; width = 0.5)"))
draw!(f[3, 1], plt3, scales(DodgeX = (; width = 1.0)); axis = (; title = "DodgeX = (; width = 1.0)"))

f