Time series
julia
using AlgebraOfGraphics, CairoMakie
using Dates

x = today() - Year(1) : Day(1) : today()
y = cumsum(randn(length(x)))
z = cumsum(randn(length(x)))
df = (; x, y, z)
plt = data(df) *
    mapping(:x, [:y, :z], color=dims(1) => "series") *
    visual(Lines)
draw(plt)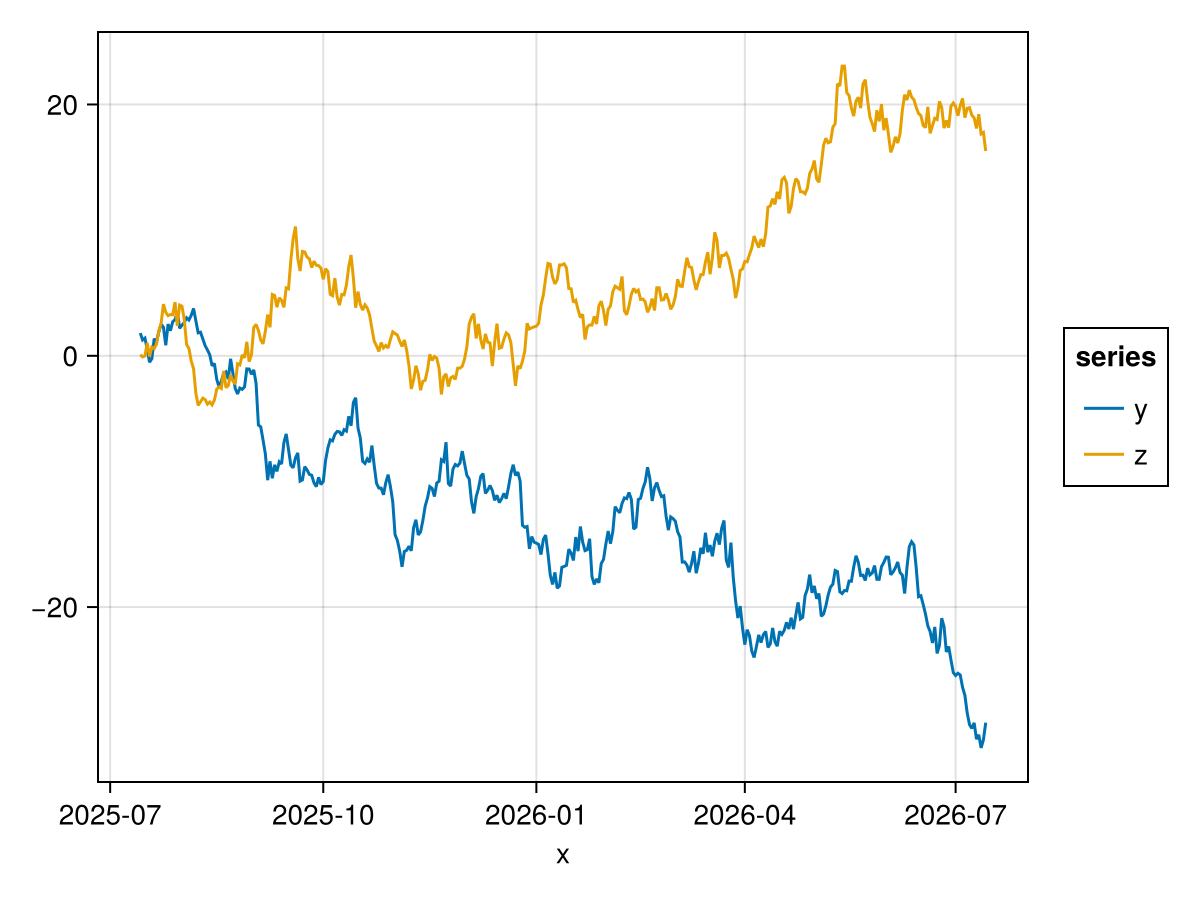
julia
x = now() - Hour(6) : Minute(1) : now()
y = cumsum(randn(length(x)))
z = cumsum(randn(length(x)))
df = (; x, y, z)
plt = data(df) *
    mapping(:x, [:y, :z], color=dims(1)) *
    visual(Lines)
fg = draw(plt, scales(Y = (; label = "value")))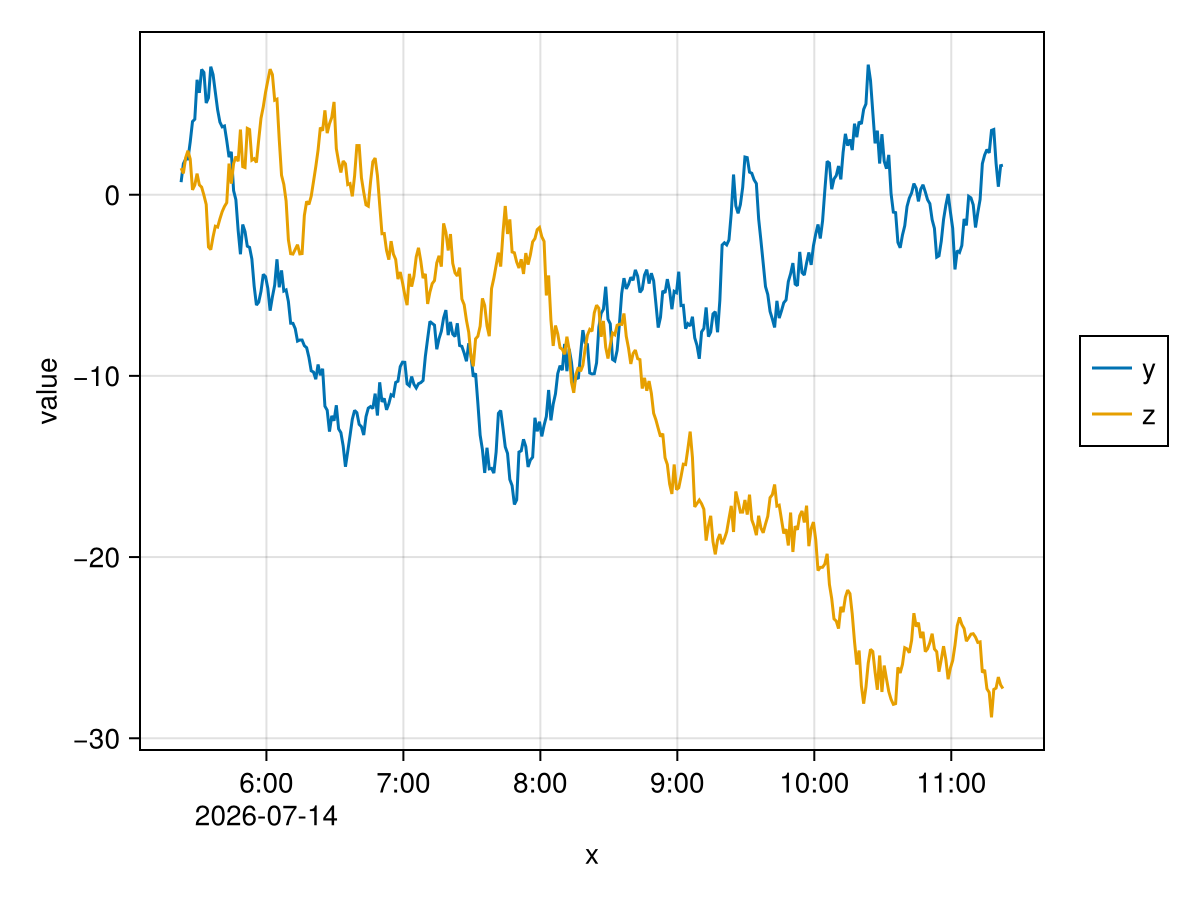
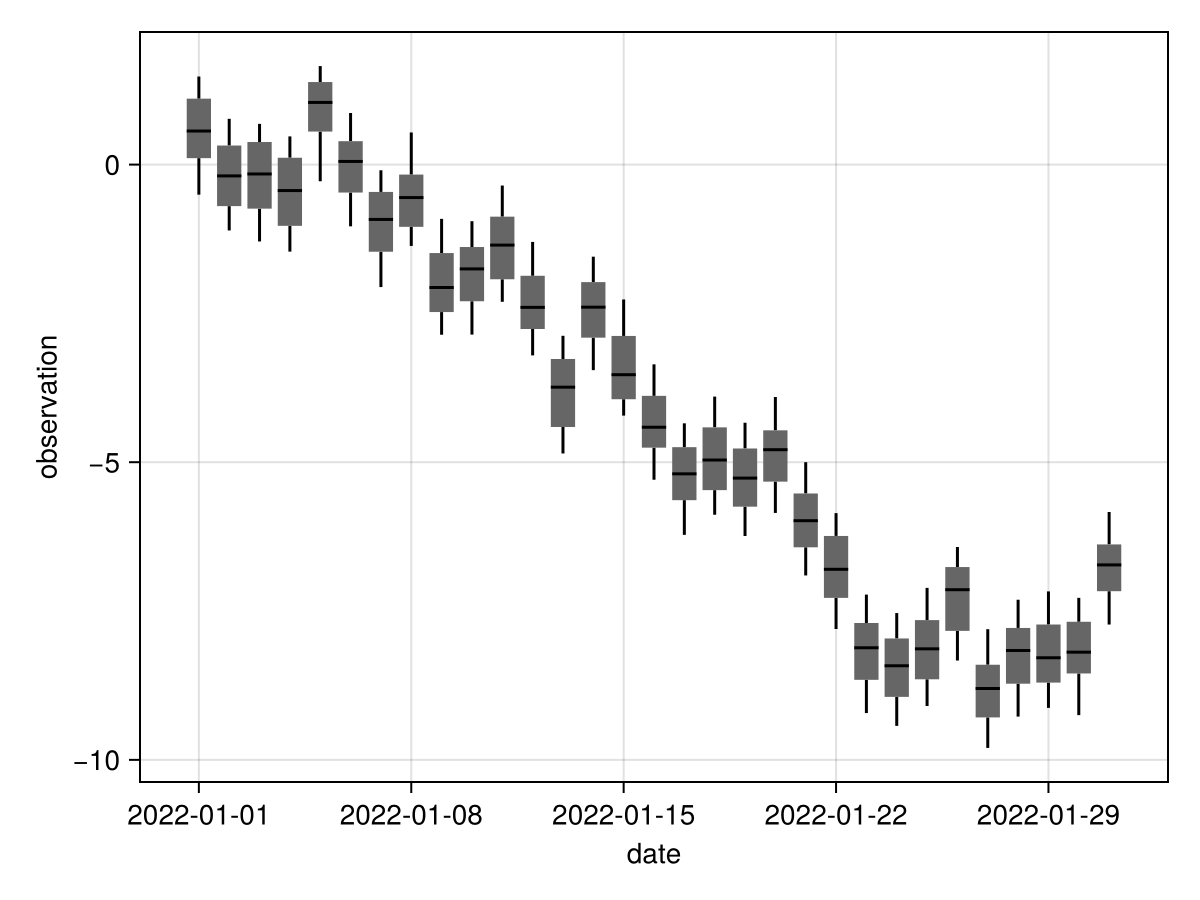
julia
dates = Date(2022, 1, 1):Day(1):Date(2022, 1, 31)
trend = cumsum(randn(31))
df = map(1:2000) do _
    idx = rand(1:31)
    date = dates[idx]
    observation = trend[idx] + 2 * rand()
    return (; date, observation)
end
plt = data(df) * mapping(:date, :observation) * visual(BoxPlot)
draw(plt)