AlgebraOfGraphics
An algebraic spin on grammar-of-graphics data visualization powered by Makie.jl
An algebraic spin on grammar-of-graphics data visualization powered by Makie.jl
AlgebraOfGraphics (AoG) defines a language for data visualization, inspired by the grammar-of-graphics system made popular by the R library ggplot2. It is based on the plotting package Makie.jl which means that most capabilities of Makie are available, and AoG plots can be freely composed with normal Makie figures.
In AlgebraOfGraphics, a few simple building blocks can be combined using + and * to quickly create complex visualizations, like this:
using AlgebraOfGraphics, CairoMakie, PalmerPenguins, DataFrames

penguins = dropmissing(DataFrame(PalmerPenguins.load()))

spec =
    data(penguins) *
    mapping(
        :bill_length_mm => "Bill length (mm)",
        :bill_depth_mm => "Bill depth (mm)",
        color = :species => "Species",
        row = :sex,
        col = :island,
    ) *
    (visual(Scatter, alpha = 0.3) + linear())

draw(spec)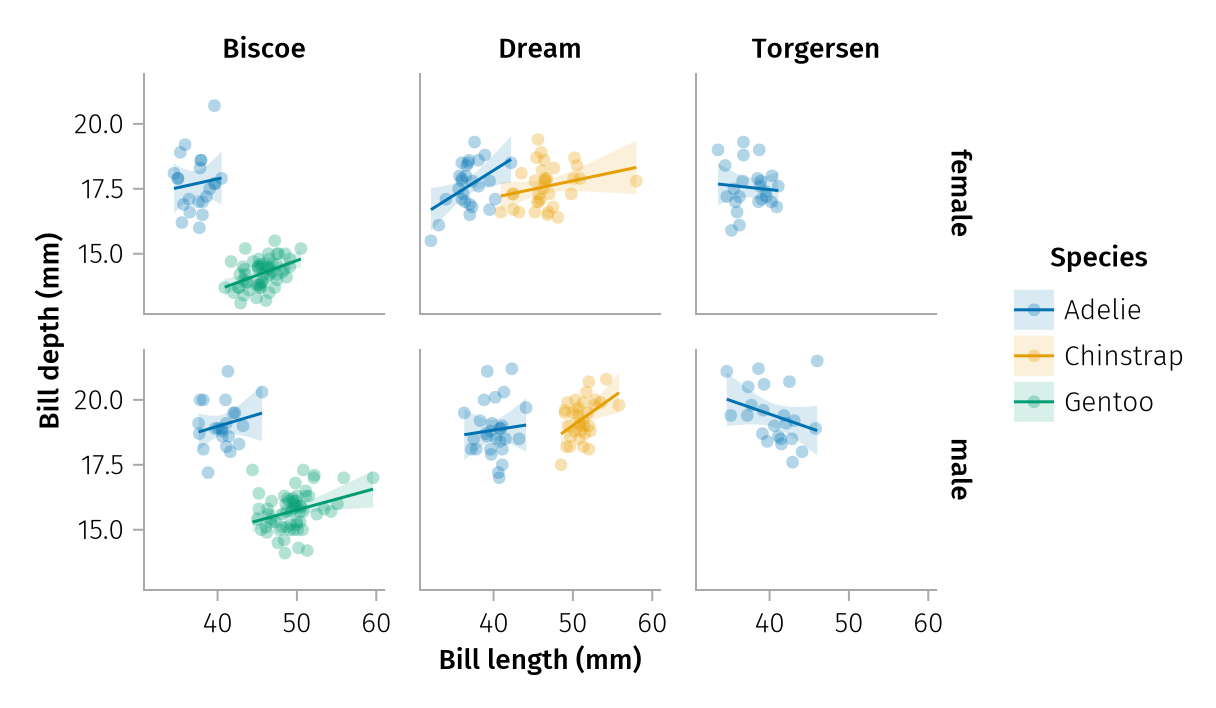
You can install AlgebraOfGraphics from the General Registry with the usual Pkg commands:
using Pkg
Pkg.add("AlgebraOfGraphics")Have a look at the Intro to AoG - I - Fundamentals tutorial to get to know AlgebraOfGraphics!