Drawing Layers
A AlgebraOfGraphics.Layer or AlgebraOfGraphics.Layers object can be plotted using the functions draw or draw!.
Whereas draw automatically adds colorbar and legend, draw! does not, as it would be hard to infer a good default placement that works in all scenarios.
Colorbar and legend, should they be necessary, can be added separately with the colorbar! and legend! helper functions. See also TODO REFLINK Nested layouts for a complex example.
Scale options
All properties that decide how scales are visualized can be modified by passing scale options (using the scales function) as the second argument of draw . The properties that are accepted differ depending on the scale aesthetic type (for example Color, Marker, LineStyle) and whether the scale is categorical or continuous.
Shared categorical scale options
All categorical scales share the following options: - legend - palette - categories
legend
Setting legend = false hides the legend for the respective scale.
using AlgebraOfGraphics
using CairoMakie

spec = data((; x = 1:9, y = 1:9, group = repeat(["A", "B", "C"], inner = 3))) *
    mapping(:x, :y, color = :group, marker = :group) *
    visual(Scatter)

f = Figure()

fg1 = draw!(f[1, 1], spec, scales(Color = (; legend = false)))
legend!(f[1, 2], fg1)

fg2 = draw!(f[2, 1], spec, scales(Marker = (; legend = false)))
legend!(f[2, 2], fg2)

f
palette
The palette decides which attribute values are passed to Makie's plotting functions for each categorical value in the scale.
Color
A Symbol is converted to a colormap with Makie.to_colormap.
using AlgebraOfGraphics
using CairoMakie

spec = data((; x = 1:10, y = 1:10, z = 'A':'J')) *
    mapping(:x, :y, color = :z) *
    visual(BarPlot)
draw(spec, scales(Color = (; palette = :tab10)))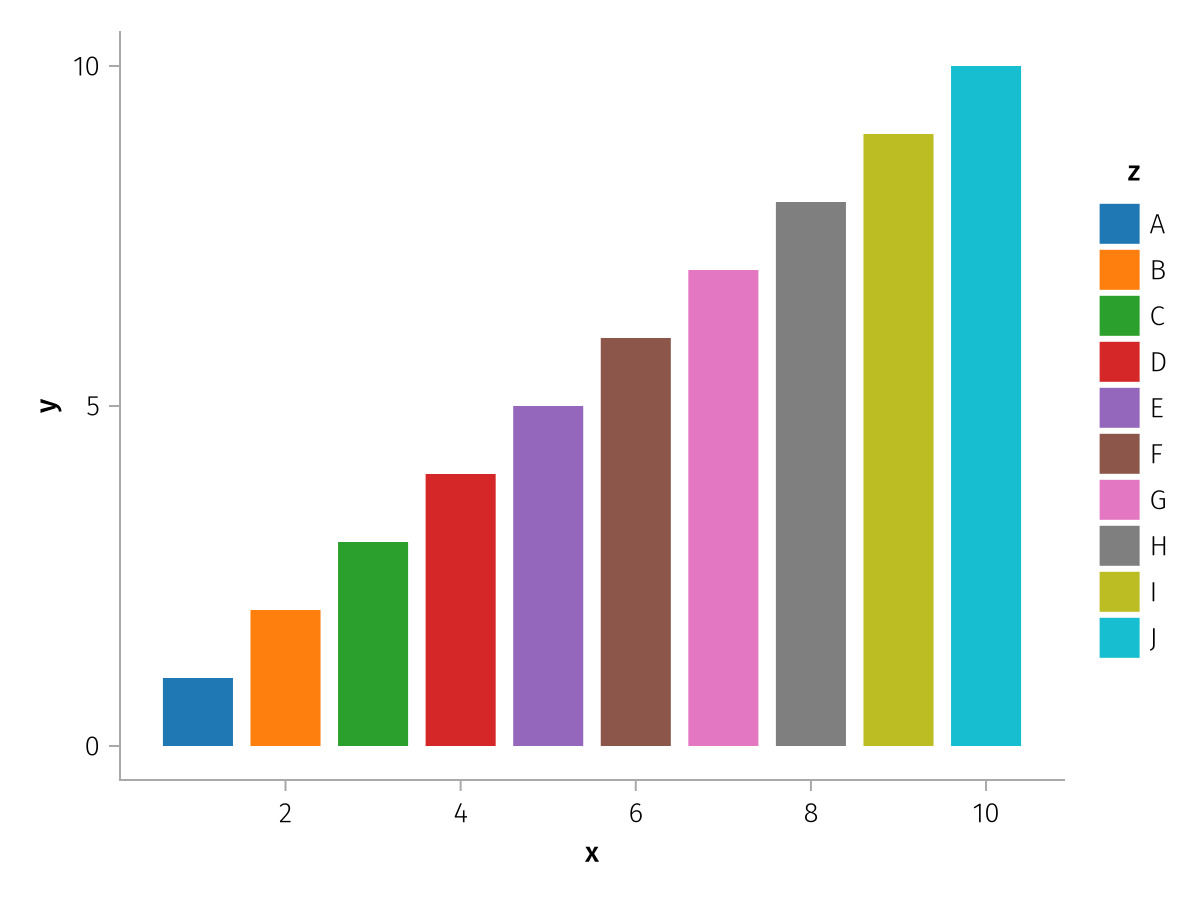
It's also possible to directly specify a vector of colors, each of which Makie.to_color can handle:
using AlgebraOfGraphics
using CairoMakie
using CairoMakie.Colors: RGB, RGBA, Gray, HSV

spec = data((; x = 1:10, y = 1:10, z = 'A':'J')) *
    mapping(:x, :y, color = :z) *
    visual(BarPlot)
draw(spec, scales(Color = (; palette = [:red, :green, :blue, RGB(1, 0, 1), RGB(1, 1, 0), "#abcff0", "#c88cbccc", HSV(0.9, 0.3, 0.7), RGBA(0.7, 0.9, 0.6, 0.5), Gray(0.5)])))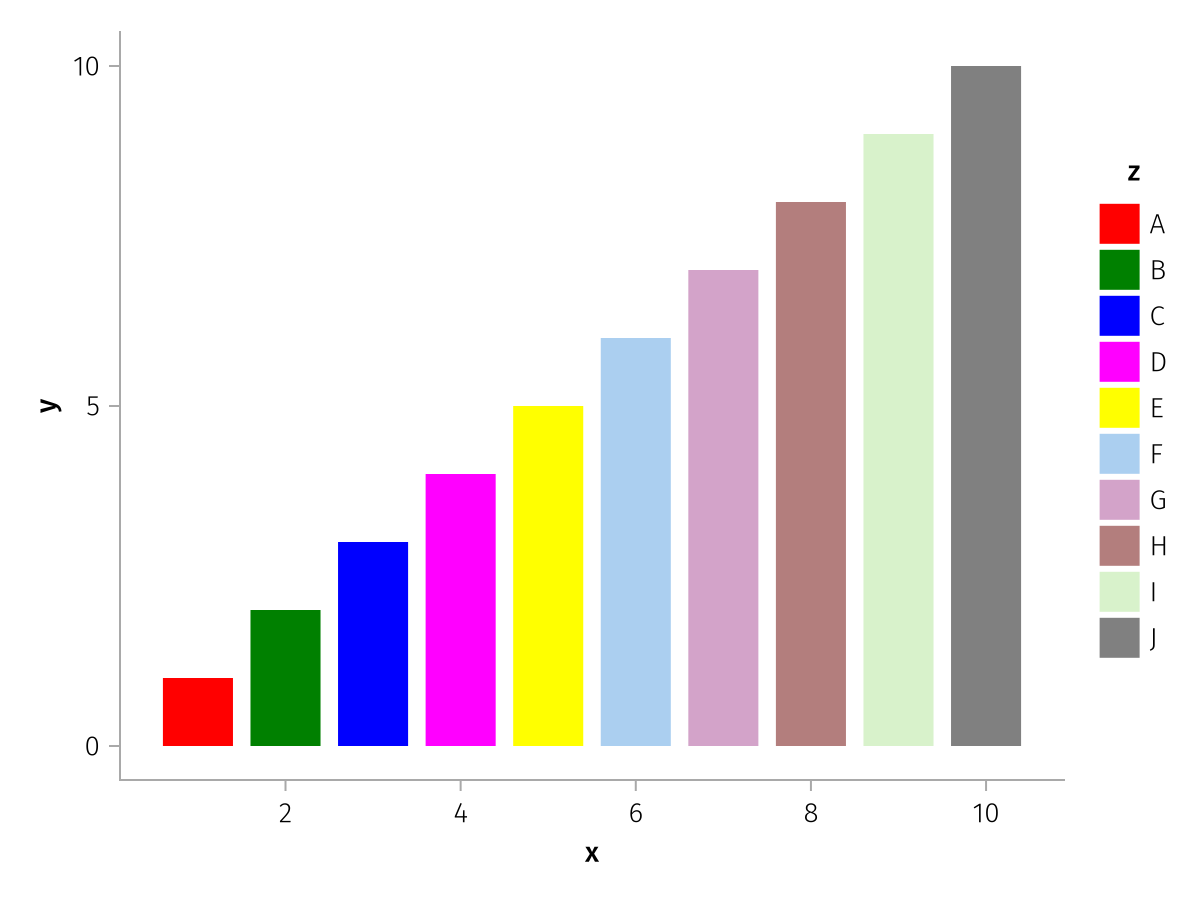
If you want to use a continuous colormap for categorical data, you can use the from_continuous helper function. It automatically takes care that the continuous colormap is sampled evenly from start to end depending on the number of categories. Any colormap that Makie understands can be passed, including named colormaps such as :viridis.
This example shows the difference in behavior when the two-element colormap [:red, :blue] is used with or without from_continuous:
using AlgebraOfGraphics
using CairoMakie

spec = data((; x = 1:10, y = 1:10, z = 'A':'J')) *
    mapping(:x, :y, color = :z) *
    visual(BarPlot)

f = Figure()
fg1 = draw!(f[1, 1], spec, scales(Color = (; palette = [:red, :blue])))
legend!(f[1, 2], fg1)
fg2 = draw!(f[1, 3], spec, scales(Color = (; palette = from_continuous([:red, :blue]))))
legend!(f[1, 4], fg2)
f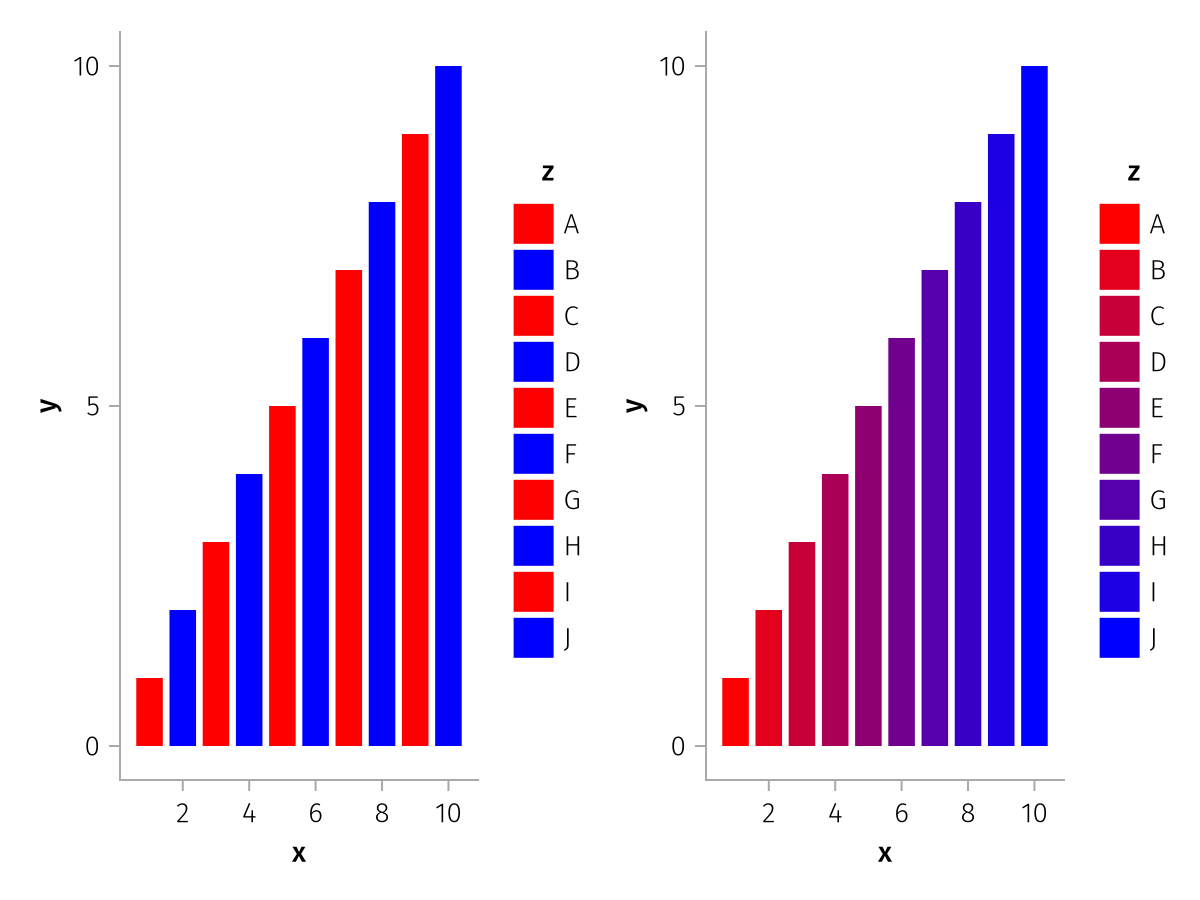
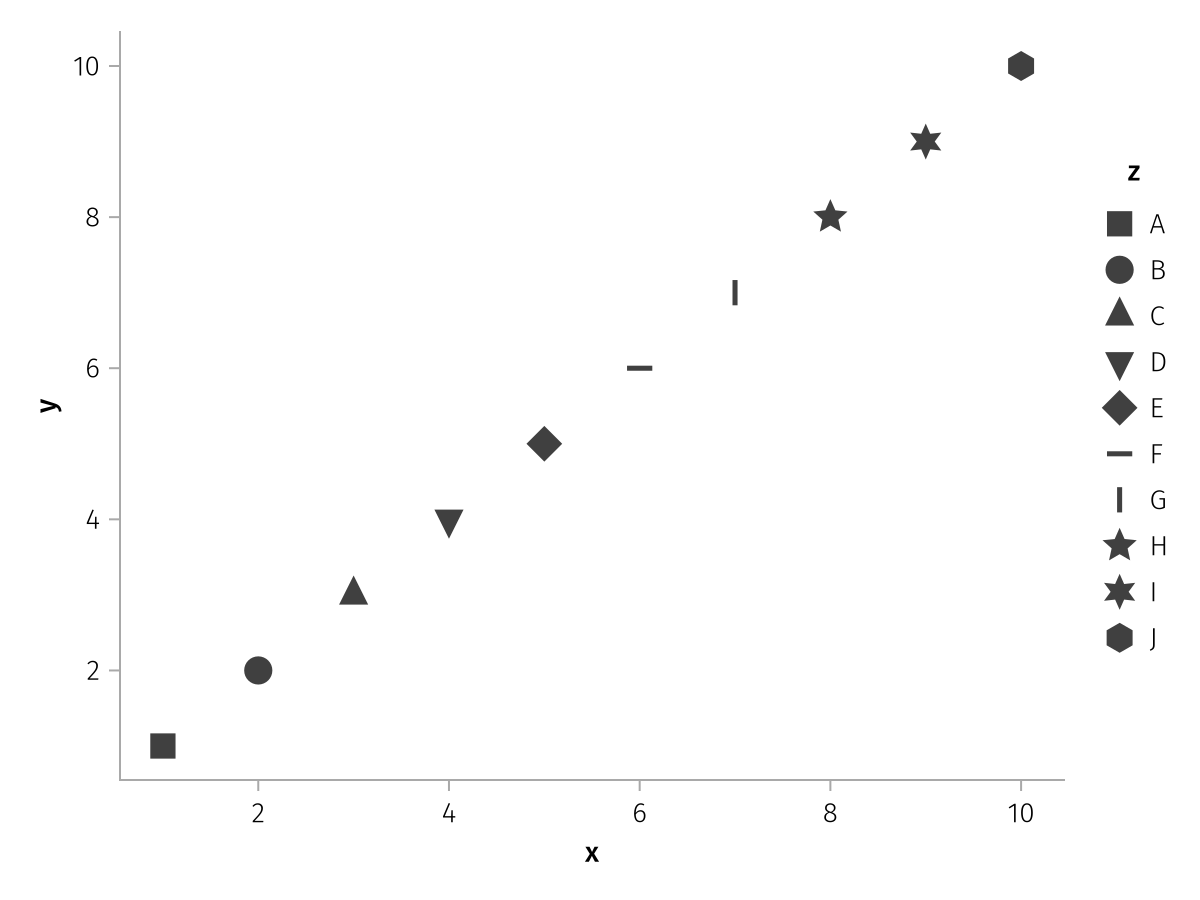
Marker
A vector of values that Makie.to_spritemarker can handle.
using AlgebraOfGraphics
using CairoMakie

spec = data((; x = 1:10, y = 1:10, z = 'A':'J')) *
    mapping(:x, :y, marker = :z) *
    visual(Scatter, markersize = 20)

draw(
    spec,
    scales(
        Marker = (; palette = [:rect, :circle, :utriangle, :dtriangle, :diamond, :hline, :vline, :star5, :star6, :hexagon])
    )
)
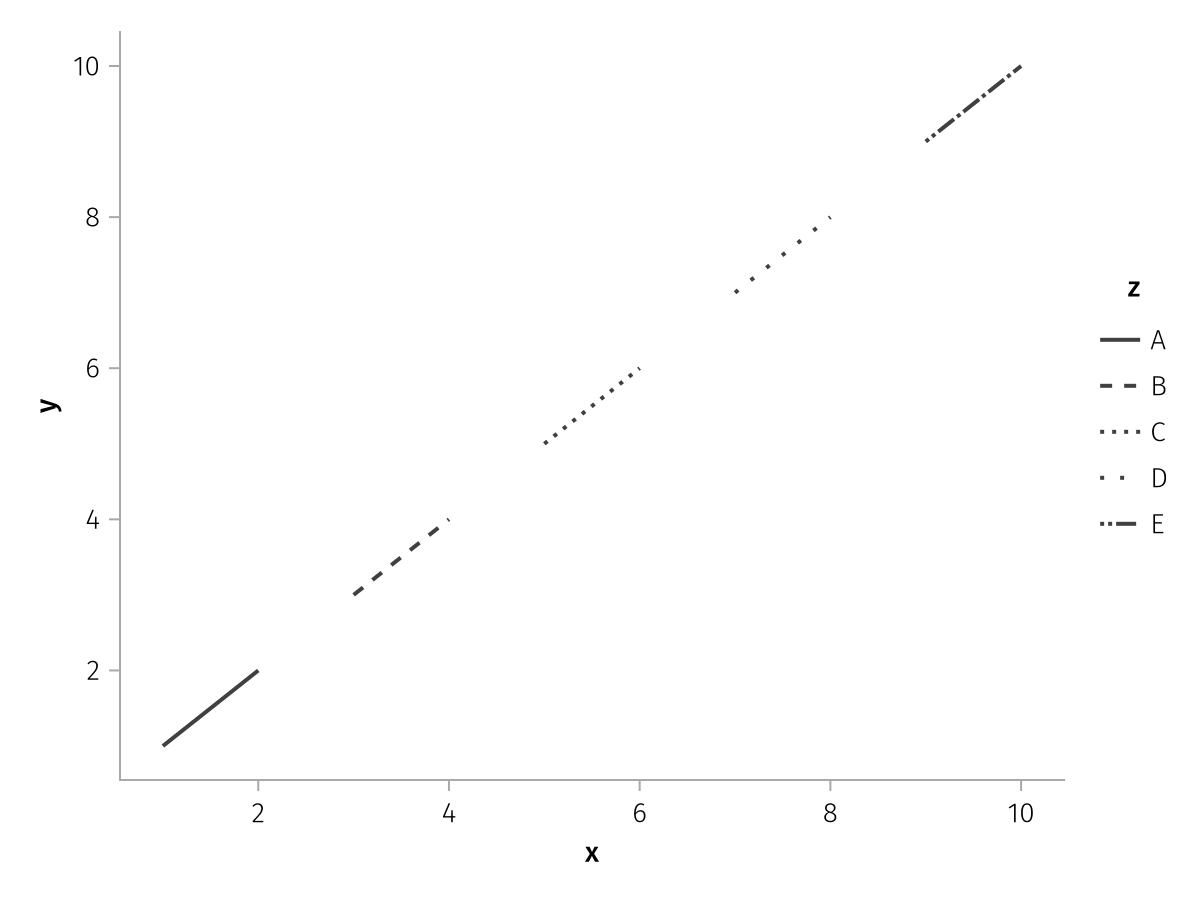
LineStyle
A vector of values that Makie.to_linestyle can handle.
using AlgebraOfGraphics
using CairoMakie

spec = data((; x = 1:10, y = 1:10, z = repeat('A':'E', inner = 2))) *
    mapping(:x, :y, linestyle = :z) *
    visual(Lines, linewidth = 2)

draw(spec, scales(
    LineStyle = (; palette = [:solid, :dash, :dot, (:dot, :loose), Linestyle([0, 1, 2, 3, 4, 8])])
))
X & Y
The "palette" values for X and Y axes are by default simply the numbers from 1 to N, the number of categories. In some circumstances, it might be useful to change these values, for example to visualize that one category is different than others. The palette values are normally assigned category-by-category in the sorted order, or in the order provided manually through the categories keyword. However, if you pass a vector of values, you can always use the category => value pair option to assign a specific category directly to a value, while the others cycle. Here, we do this with "Unknown" as it would otherwise be sorted before "X".
using AlgebraOfGraphics
using CairoMakie

df = (; group = ["A", "B", "C", "X", "Y", "Unknown"], count = [45, 10, 20, 32, 54, 72])

spec = data(df) * mapping(:group, :count) * visual(BarPlot)

draw(spec, scales(X = (; palette = [1, 2, 3, 5, 6, "Unknown" => 8])))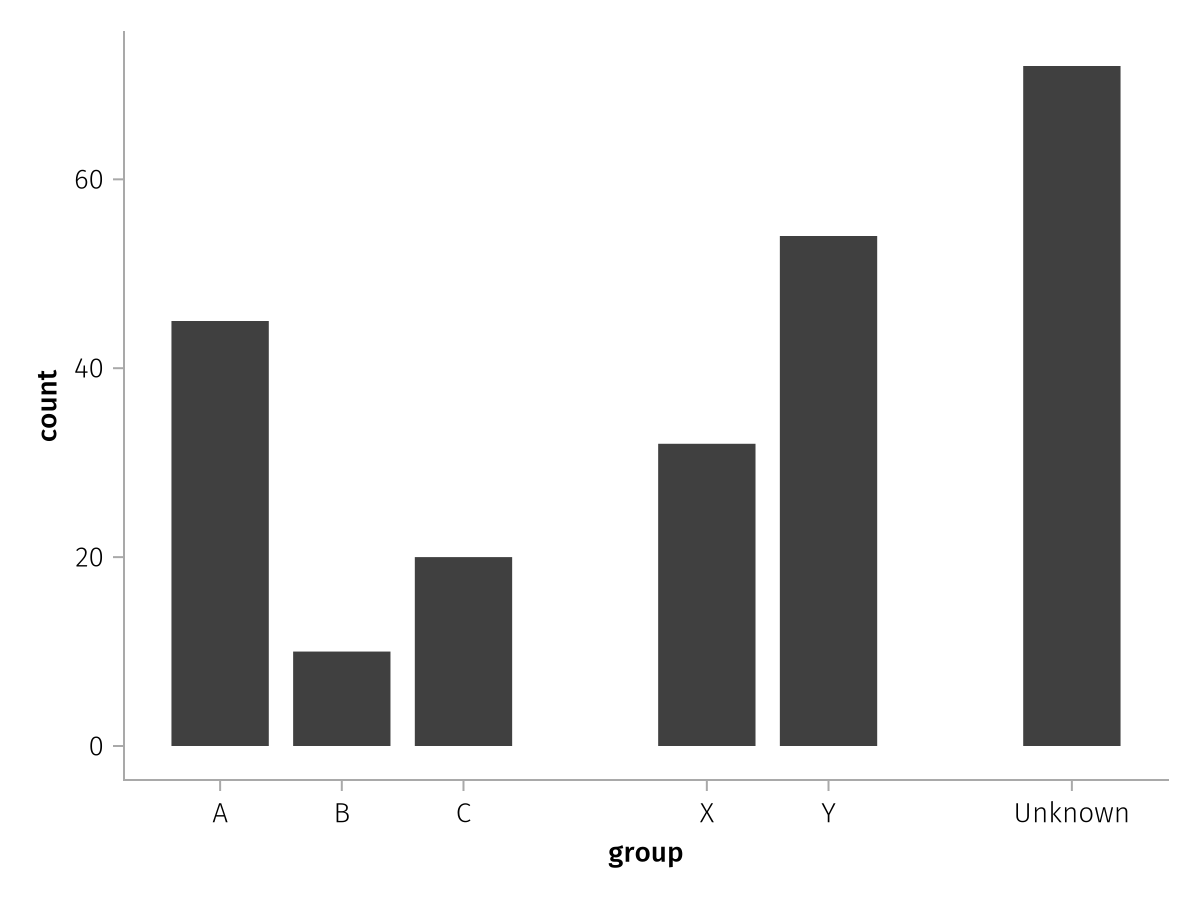
Layout
Normally, with the Layout aesthetic, rows wrap automatically such that an approximately square distribution of facets is attained. You can overwrite these values, however, to place axes at manually chosen positions:
using AlgebraOfGraphics
using CairoMakie

df = (;
    group = repeat(["A", "B", "C", "D", "E", "F", "G", "H"], inner = 20),
    x = randn(160),
    y = randn(160)
)

spec = data(df) * mapping(:x, :y, layout = :group) * visual(Scatter)

clockwise = [(1, 1), (1, 2), (1, 3), (2, 3), (3, 3), (3, 2), (3, 1), (2, 1)]

draw(spec, scales(Layout = (; palette = clockwise)))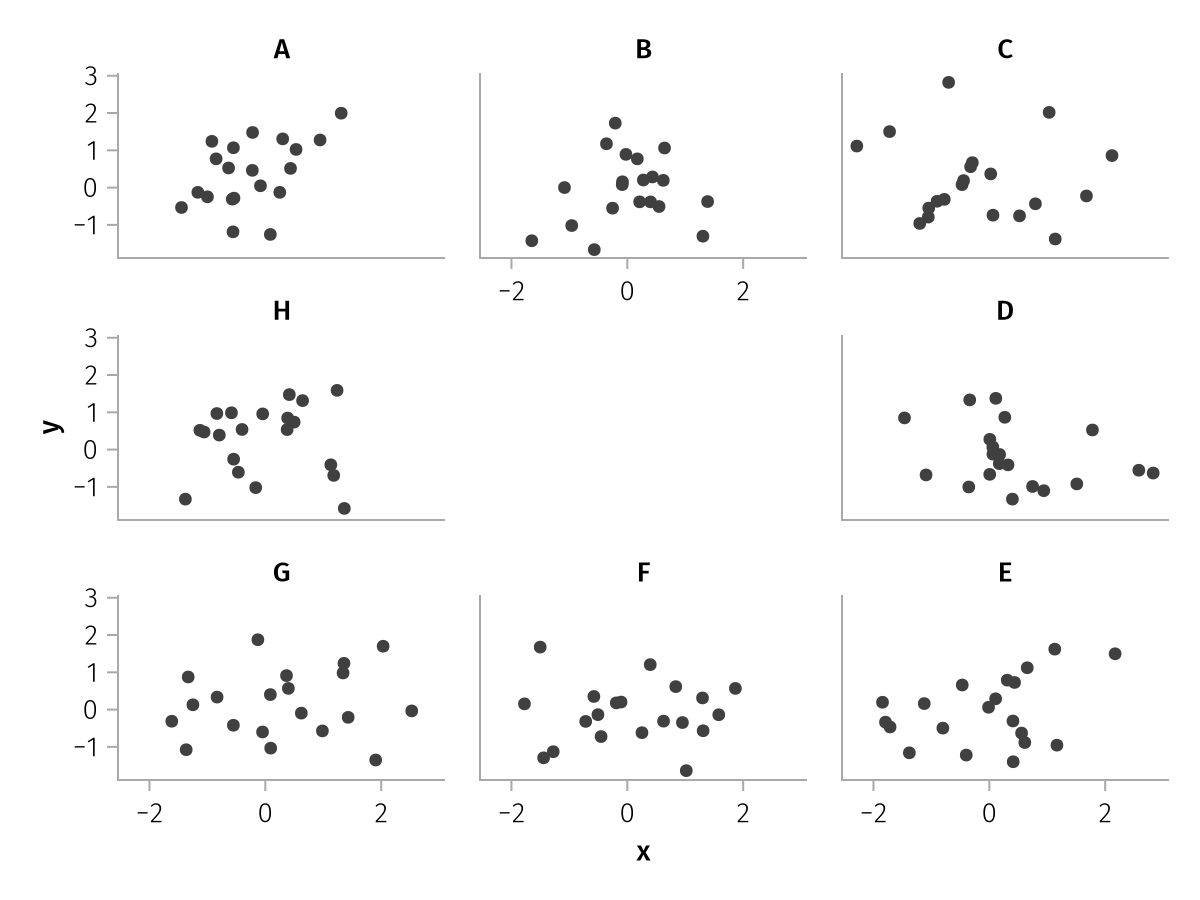
categories
The categories keyword can be used to reorder, label and even add categorical values.
Some reordering and renaming can be done using the sorter and renamer helper functions applied directly to columns in mapping. However, this works less well when several data sources are combined where not all categories appear in each column. Also, no categories can be added this way, which is something that can be useful if the existence of categories should be shown even though there is no data for them.
New labels can be assigned using the value => label pair syntax.
using AlgebraOfGraphics
using CairoMakie

spec = data((; group = ["A", "C", "D"], value = [1, 3, 4])) *
    mapping(:group, :value) * visual(BarPlot)

f = Figure()

draw!(f[1, 1], spec, scales(
    X = (; categories = ["A", "B", "C", "D"])
))
draw!(f[1, 2], spec, scales(
    X = (; categories = ["D", "A", "C"])
))
draw!(f[1, 3], spec, scales(
    X = (; categories = ["A" => "a", "C" => "c", "D" => "d"])
))

f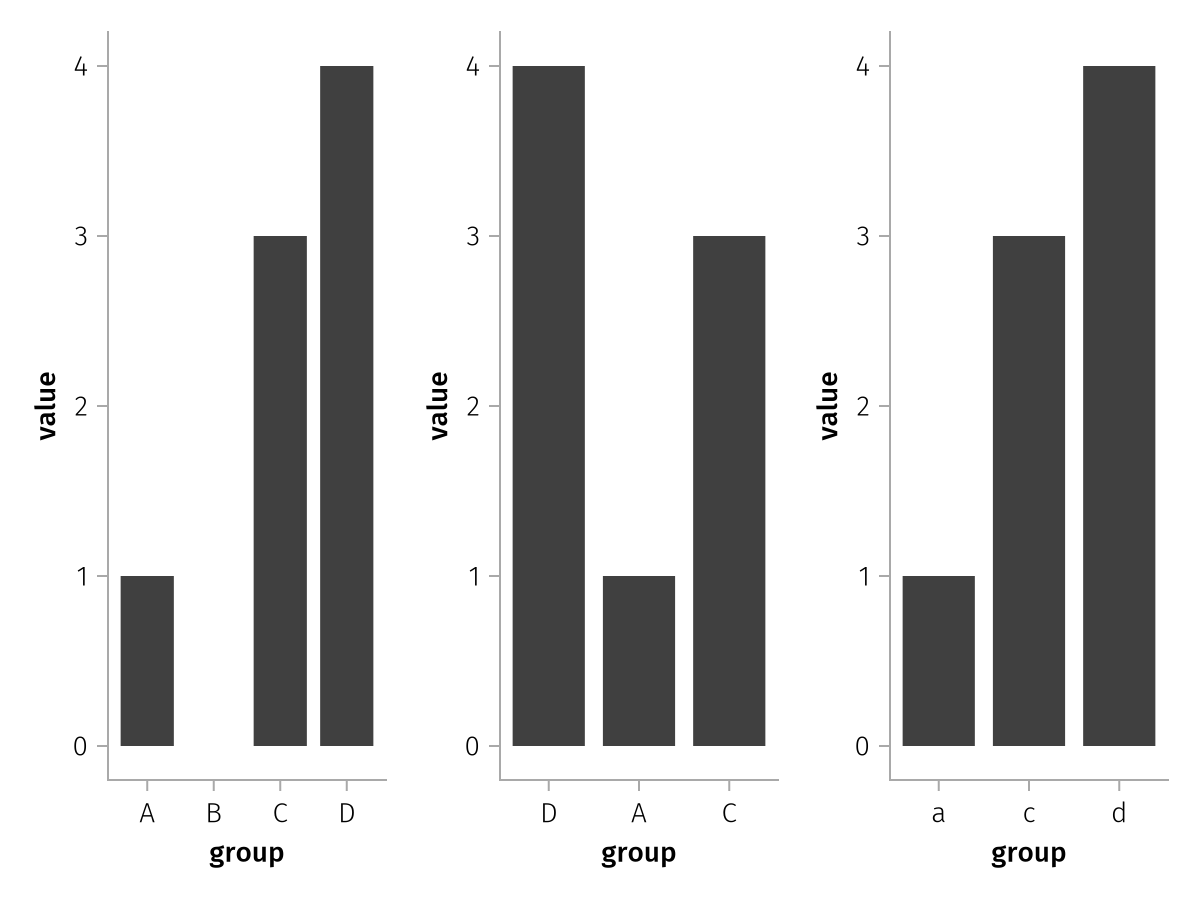
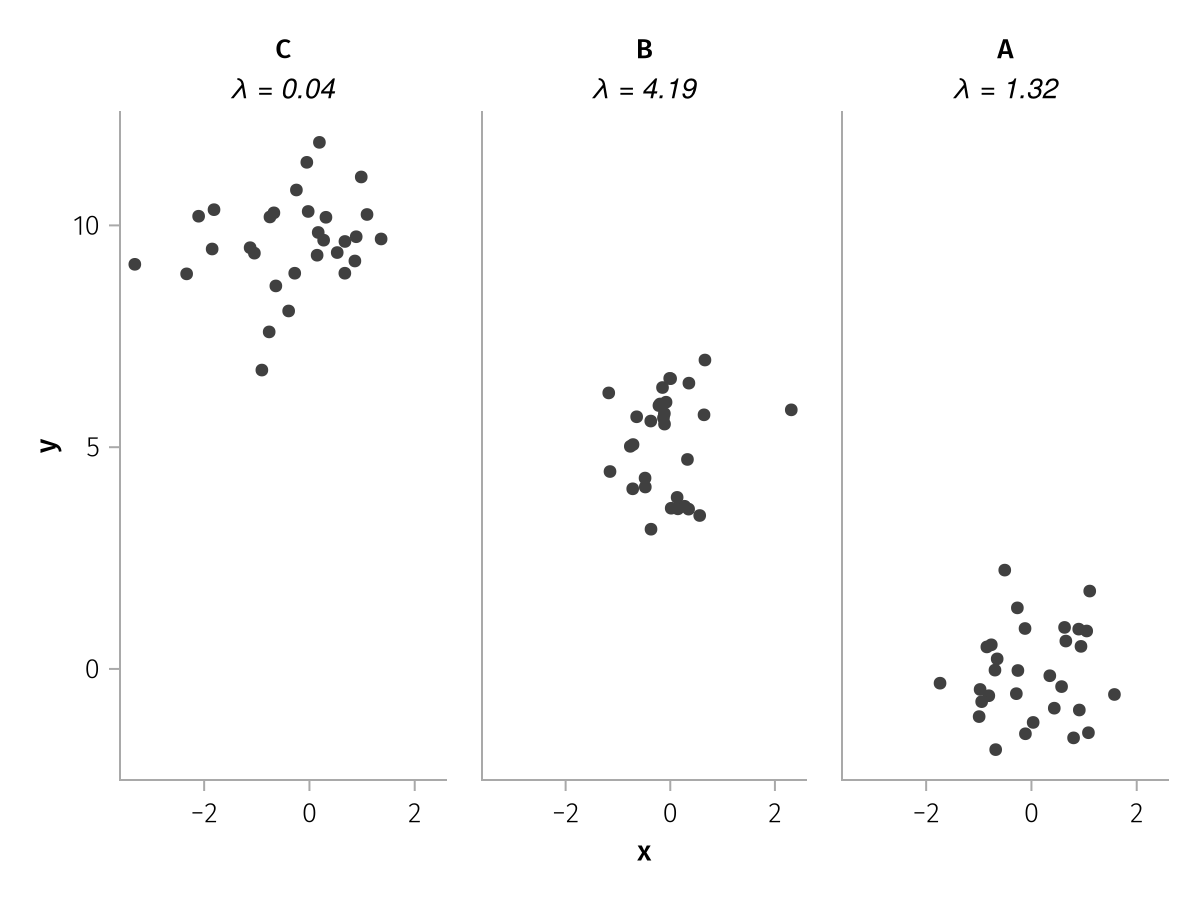
You can also pass a Function to categories which should take the vector of category values and return a new vector of categories or category/label pairs.
For example, you could add summary statistics to the facet layout titles this way, by grabbing them from a dictionary computed separately.
using AlgebraOfGraphics
using CairoMakie

summary_stats = Dict("A" => 1.32, "B" => 4.19, "C" => 0.04)

df = (;
    x = randn(90),
    y = randn(90) .+ repeat([0, 5, 10], inner = 30),
    group = repeat(["A", "B", "C"], inner = 30)
)

spec = data(df) * mapping(:x, :y, col = :group) * visual(Scatter)

draw(spec, scales(Col = (;
    categories = cats -> [
        cat => rich("$cat\n", rich("λ = $(summary_stats[cat])", font = :italic))
            for cat in reverse(cats)
        ]
)))
Special categorical scale options
Row, Col & Layout
All three facetting scales have the option show_labels which is true by default and can be set to false to hide the facet labels.
This example shows the behavior for Col only:
using AlgebraOfGraphics
using CairoMakie

spec = data((;
    x = 1:16,
    y = 17:32,
    group1 = repeat(["A", "B"], inner = 8),
    group2 = repeat(["C", "D"], 8))
) * mapping(:x, :y, row = :group1, col = :group2) * visual(Scatter)

draw(spec, scales(Col = (; show_labels = false)))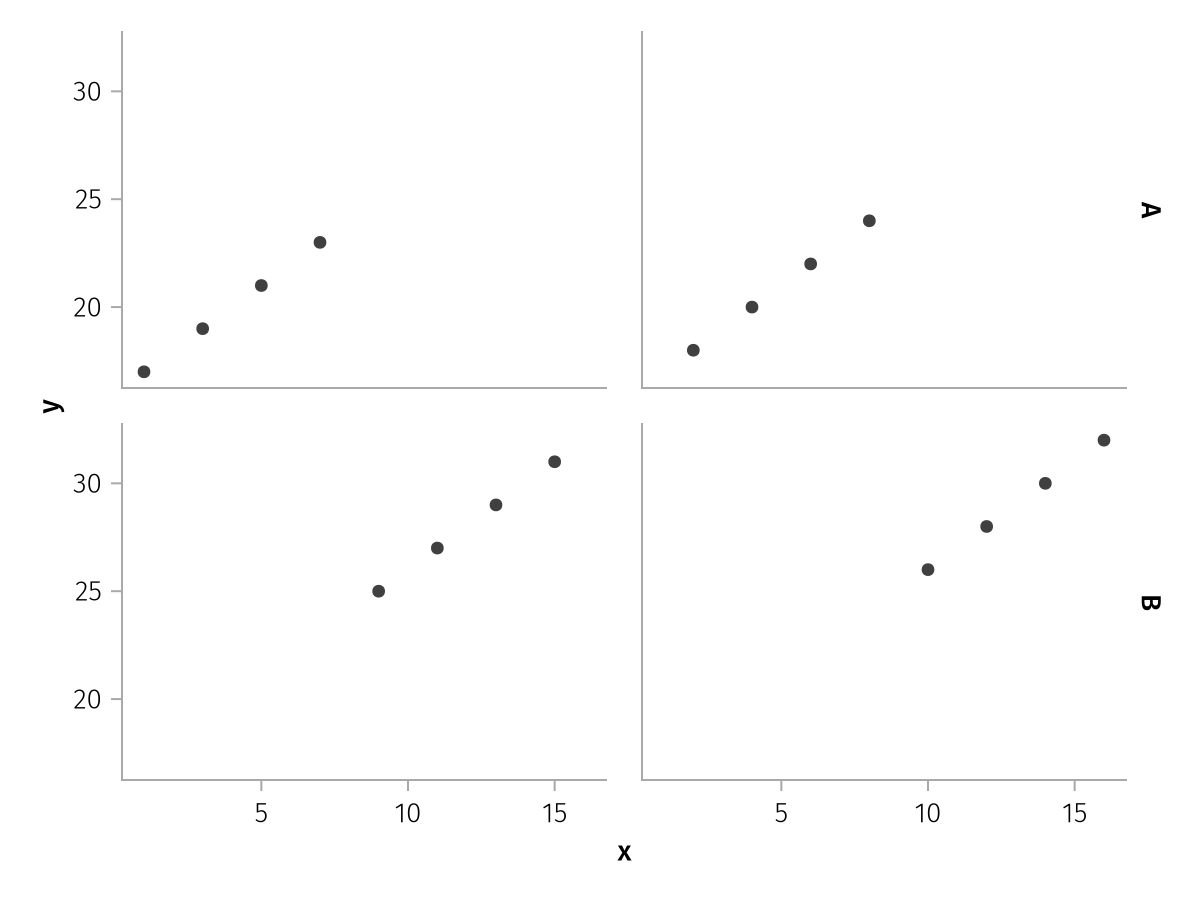
Continuous scale options
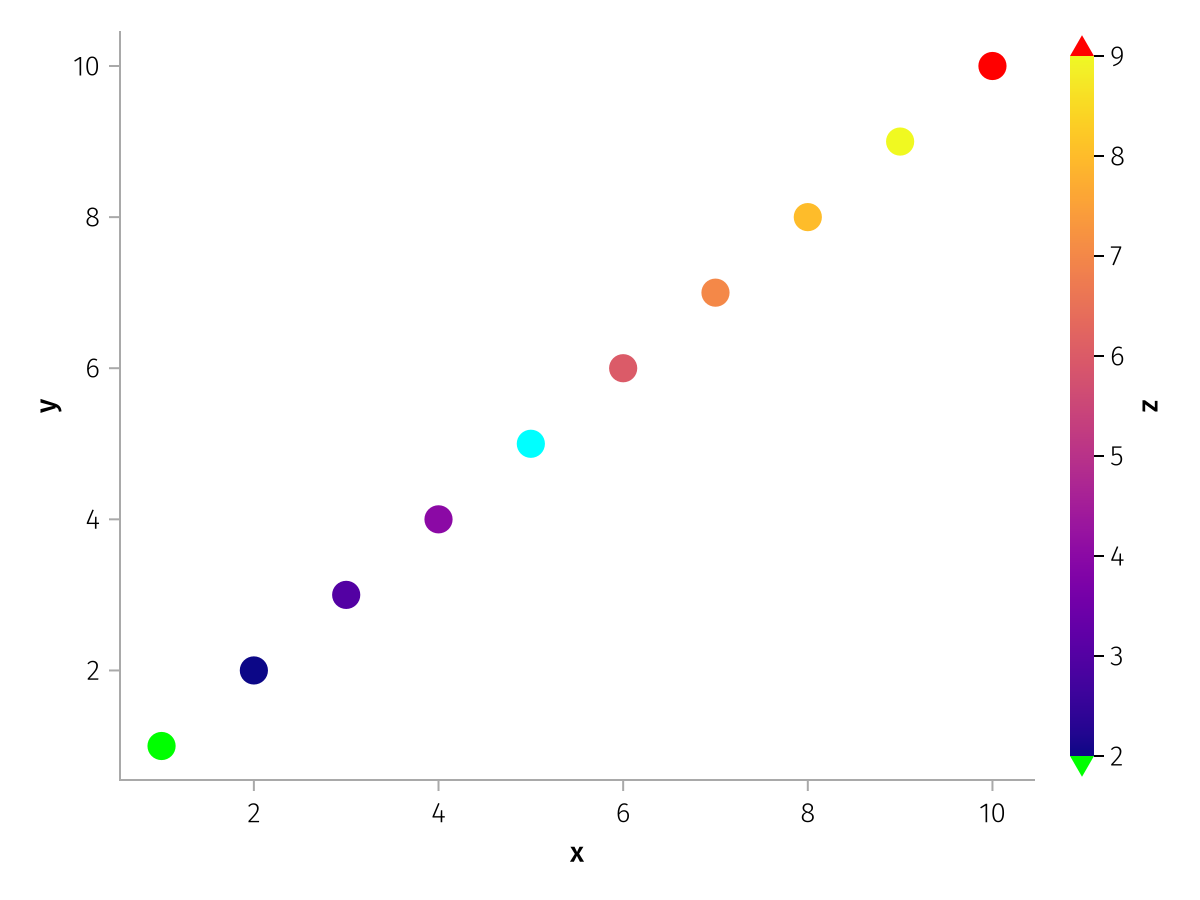
Color
Continuous color scales can be modified using the familiar Makie attributes colormap, colorrange, highclip, lowclip and nan_color. By default, colorrange is set to the extrema of the encountered values, so no clipping occurs.
using AlgebraOfGraphics
using CairoMakie

spec = data((; x = 1:10, y = 1:10, z = [1:4; NaN; 6:10])) *
    mapping(:x, :y, color = :z) *
    visual(Scatter, markersize = 20)

draw(spec, scales(
    Color = (;
        colormap = :plasma,
        nan_color = :cyan,
        lowclip = :lime,
        highclip = :red,
        colorrange = (2, 9)
    )
))
MarkerSize
The range of marker sizes can be set with the sizerange attribute. Marker sizes are computed such that their area, and not markersize itself, grows linearly with the scale values.
using AlgebraOfGraphics
using CairoMakie

spec = data((; x = 1:10, y = 1:10, z = 10:10:100)) *
    mapping(:x, :y, markersize = :z) *
    visual(Scatter)

f = Figure()

grid = draw!(f[1, 1], spec, scales(
    MarkerSize = (;
        sizerange = (5, 15)
    )
))
legend!(f[1, 2], grid)

grid2 = draw!(f[2, 1], spec, scales(
    MarkerSize = (;
        sizerange = (5, 30)
    )
))
legend!(f[2, 2], grid2)

f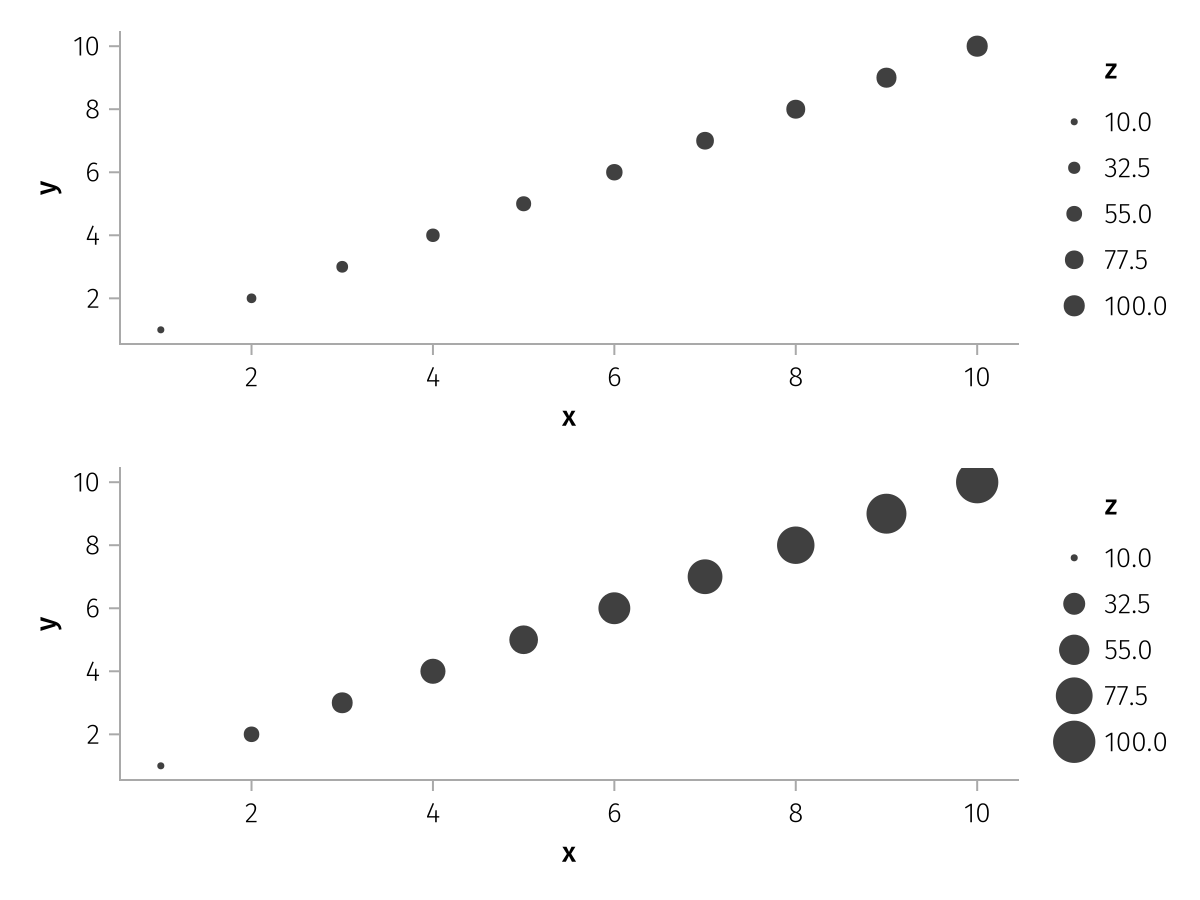
Legend options
The legend keyword forwards most attributes to Makie's Legend function. The exceptions are listed here.
show
Setting show = false hides the legend completely. This applies to draw and not draw! as the latter doesn't draw the legend automatically.
using AlgebraOfGraphics
using CairoMakie

spec = data((x = 1:3, y = 1:3, group = ["A", "B", "C"])) * mapping(:x, :y, color = :group) * visual(Scatter)

draw(spec; legend = (; show = false))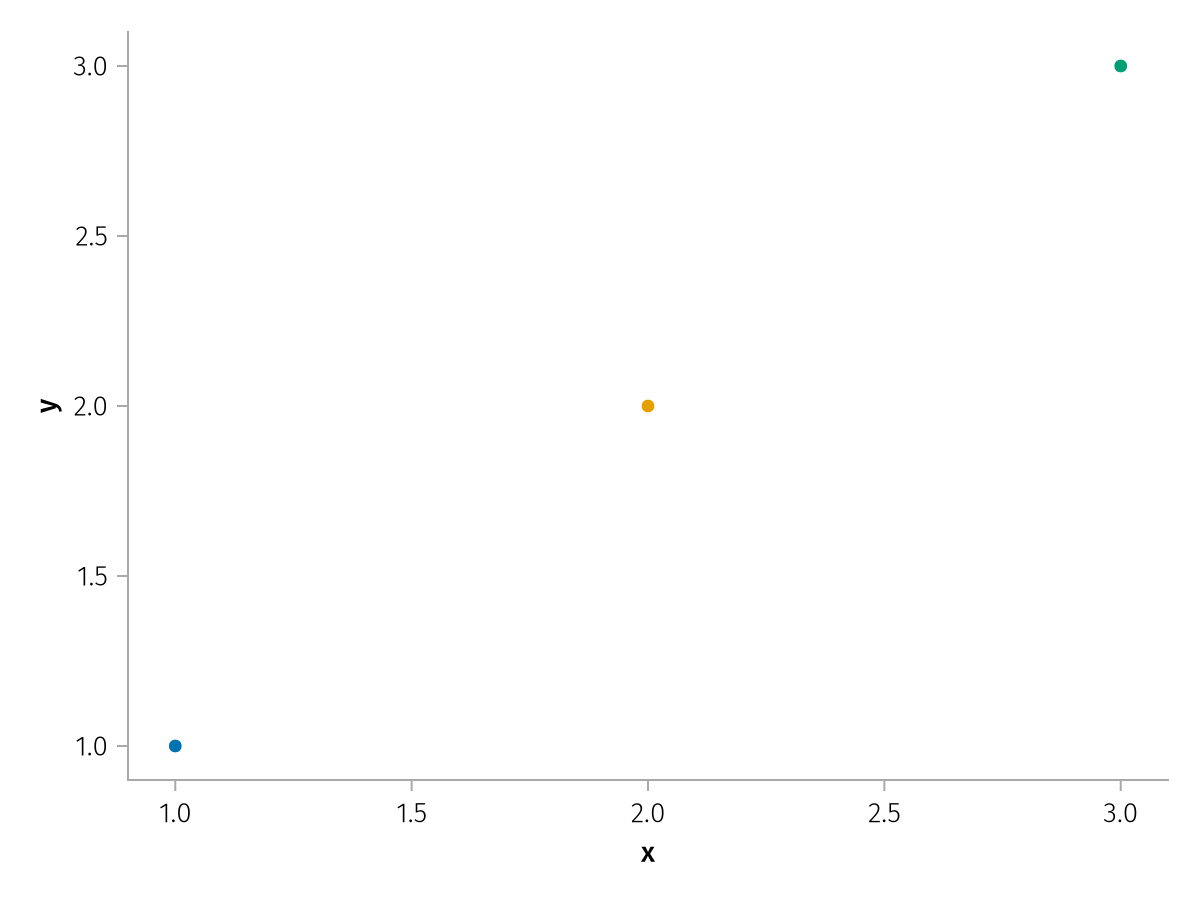
order
By default, the legend order depends on the order in which layers and mappings have been defined, as well as whether scales are categorical or continuous.
using AlgebraOfGraphics
using CairoMakie

df = (;
    x = 1:12,
    y = 1:12,
    z = 1:12,
    group1 = repeat(["A", "B", "C"], inner = 4),
    group2 = repeat(["X", "Y"], 6),
)

spec = data(df) *
    mapping(:x, :y, markersize = :z, color = :group1, marker = :group2) *
    visual(Scatter)

draw(spec)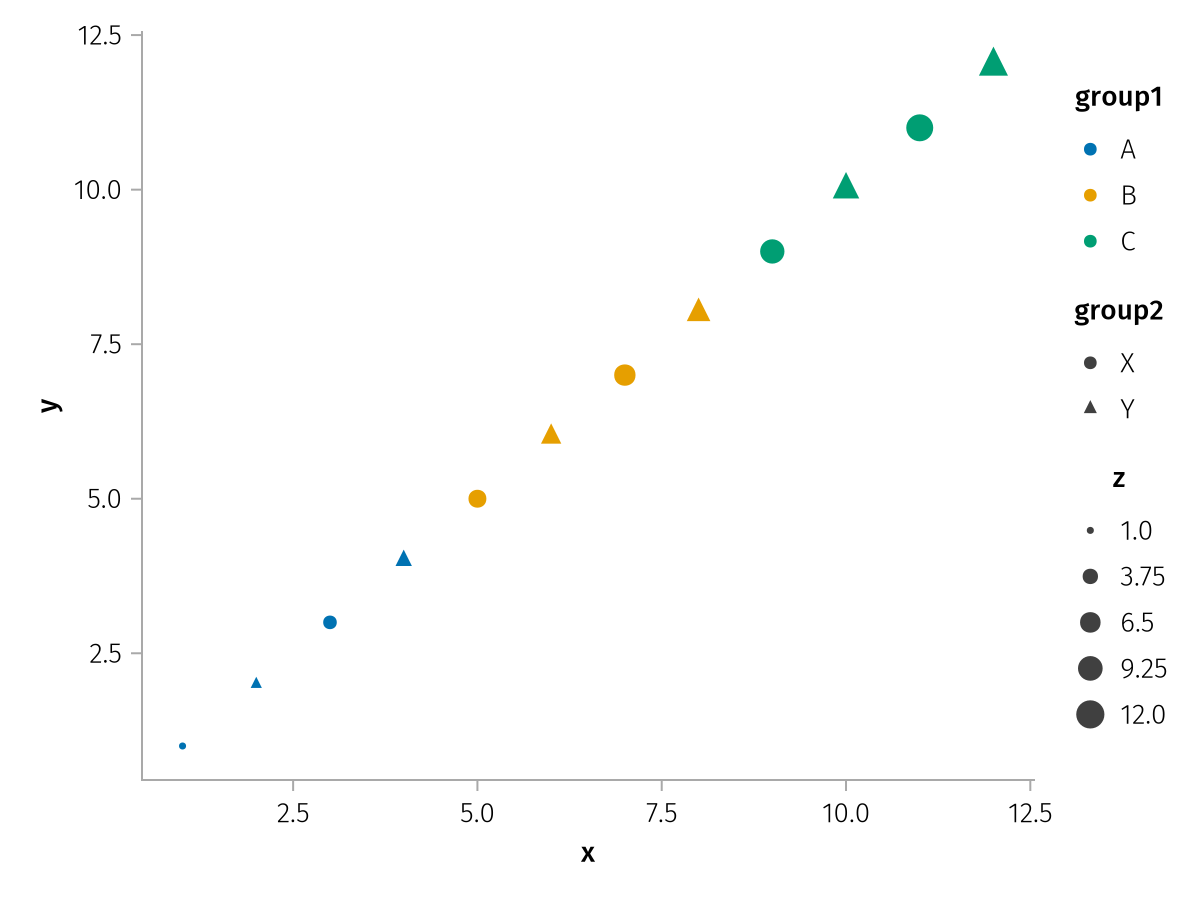
You can reorder the legend with the order keyword. This expects a vector with either Symbols or Vector{Symbol}s as elements, where each Symbol is the identifier for a scale that's represented in the legend.
Plain Symbols can be used for simple reordering:
draw(spec; legend = (; order = [:MarkerSize, :Color, :Marker]))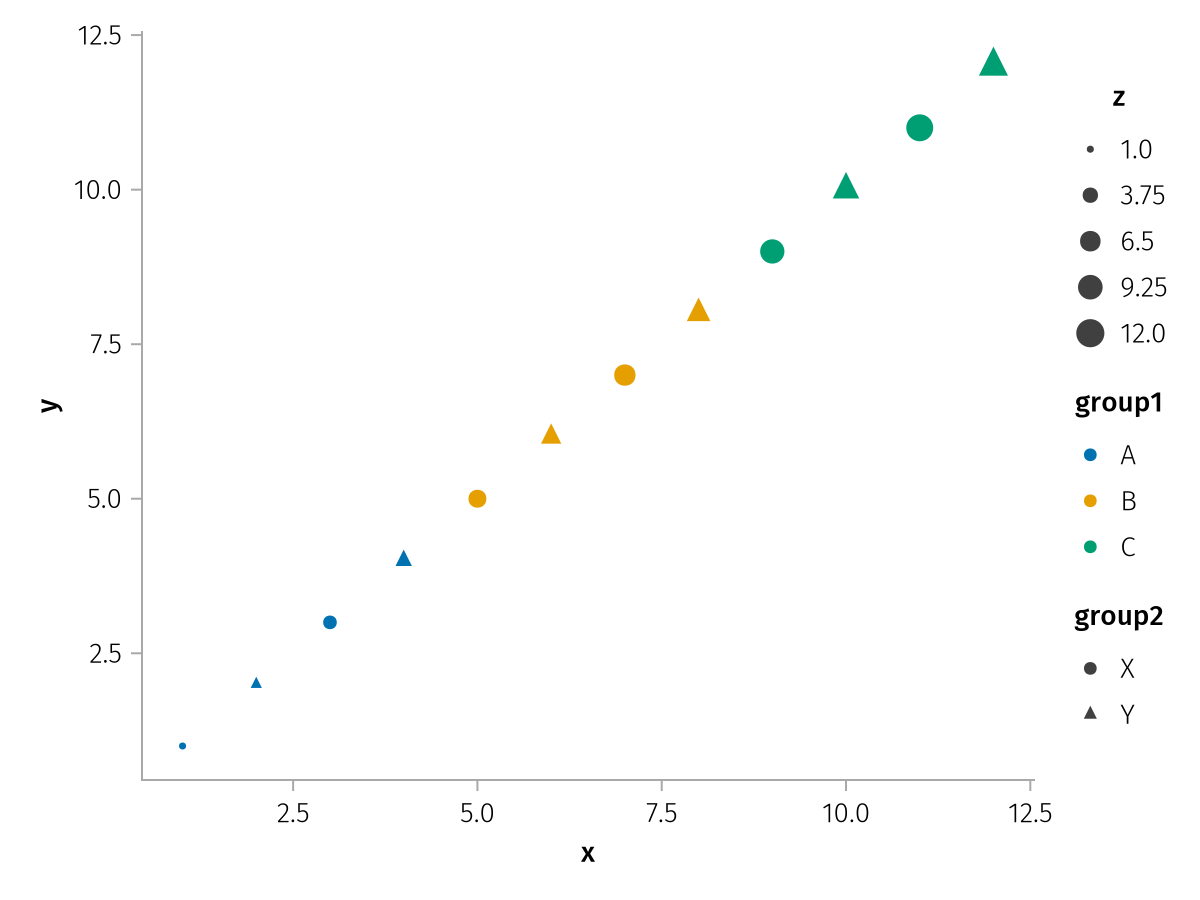
Symbols that are grouped into Vectors indicate that their groups should be merged together. For example, consider this plot that features two color scales, but one for a scatter plot and one for a line plot.
using AlgebraOfGraphics
using CairoMakie

df_a = (; x = 1:9, y = [1, 2, 3, 5, 6, 7, 9, 10, 11], group = repeat(["A", "B", "C"], inner = 3))

spec1 = data(df_a) * mapping(:x, :y, strokecolor = :group) * visual(Scatter, color = :transparent, strokewidth = 3, markersize = 15)

df_b = (; y = [4, 8], threshold = ["first", "second"])

spec2_custom_scale = data(df_b) * mapping(:y, color = :threshold => scale(:color2)) * visual(HLines)

draw(spec1 + spec2_custom_scale)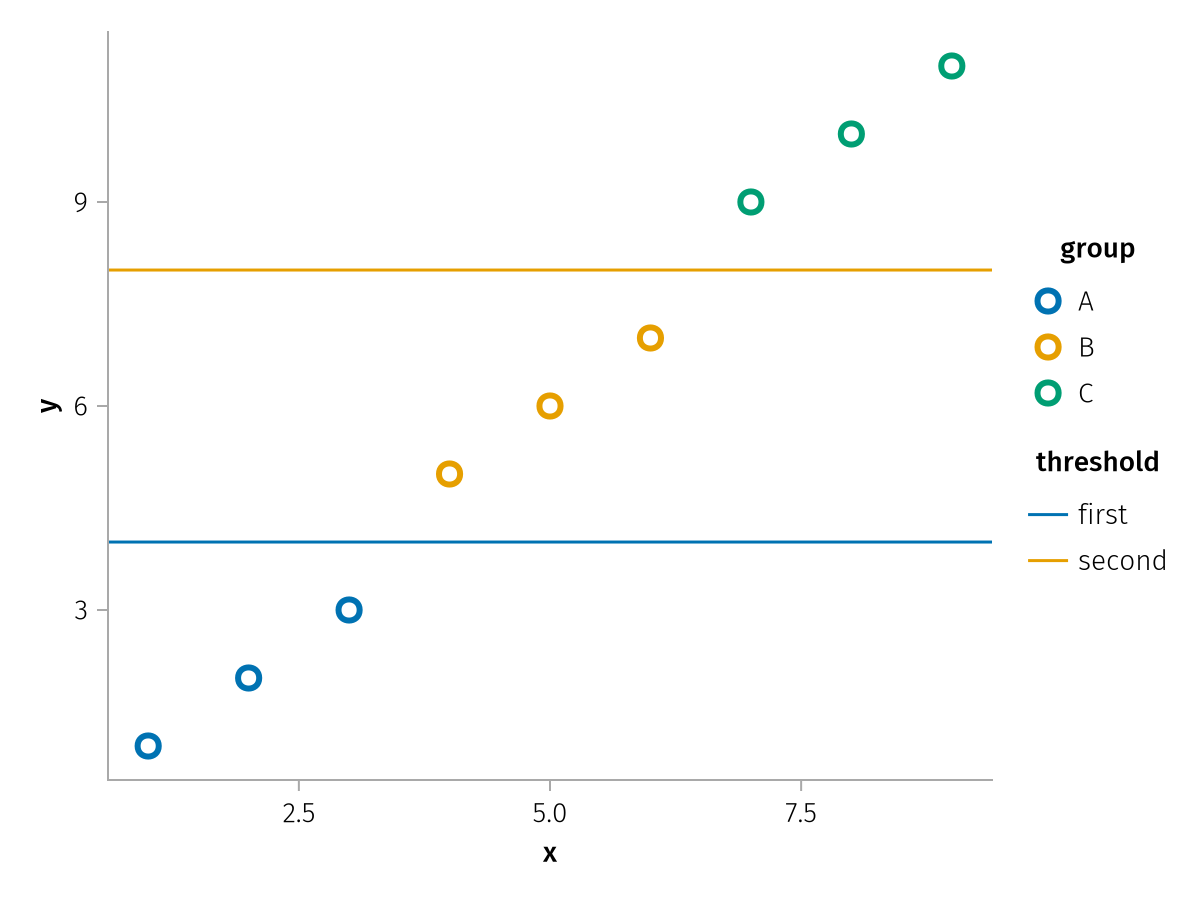
You can group the two scales together using order. The titles are dropped.
draw(spec1 + spec2_custom_scale; legend = (; order = [[:Color, :color2]]))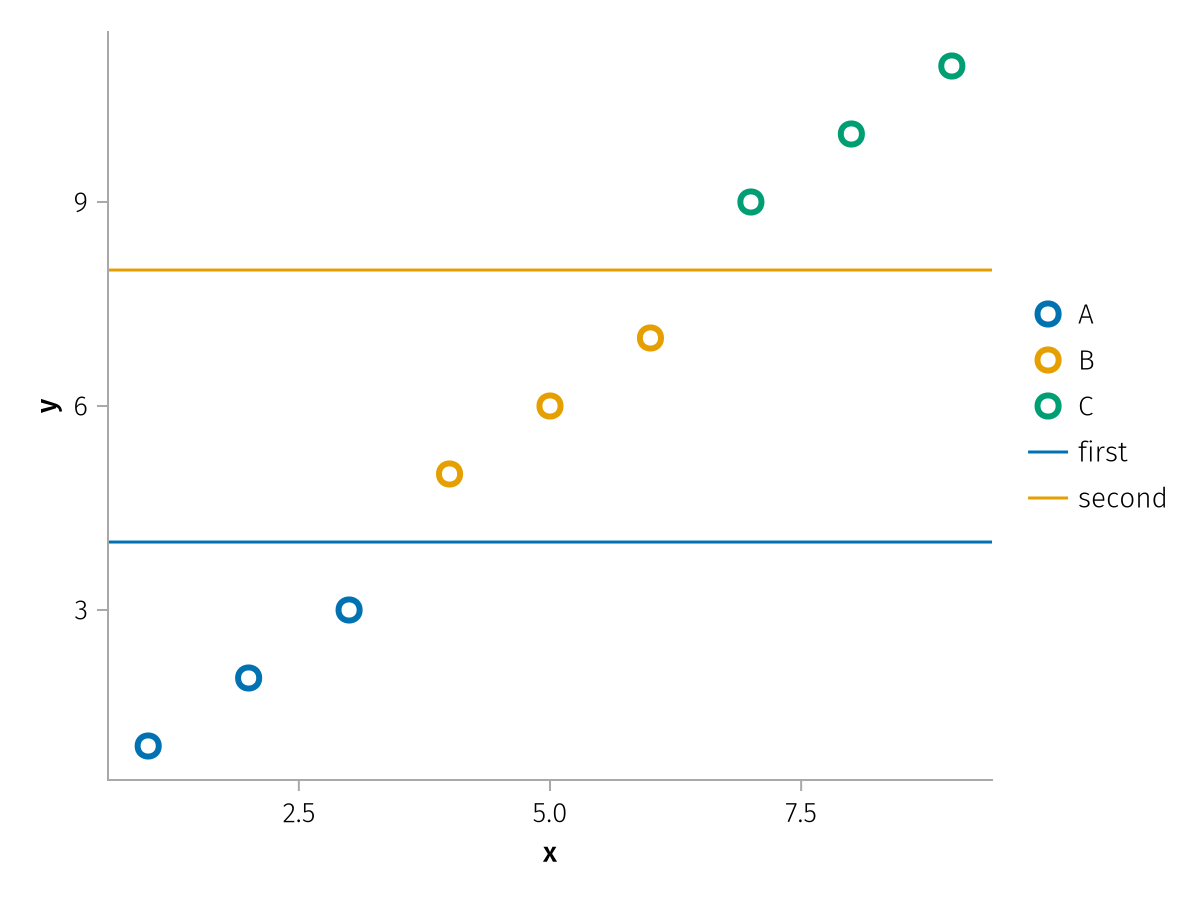
If you want to add a title to a merged group, you can add it with the group => title pair syntax:
draw(spec1 + spec2_custom_scale; legend = (; order = [[:Color, :color2] => "Title"]))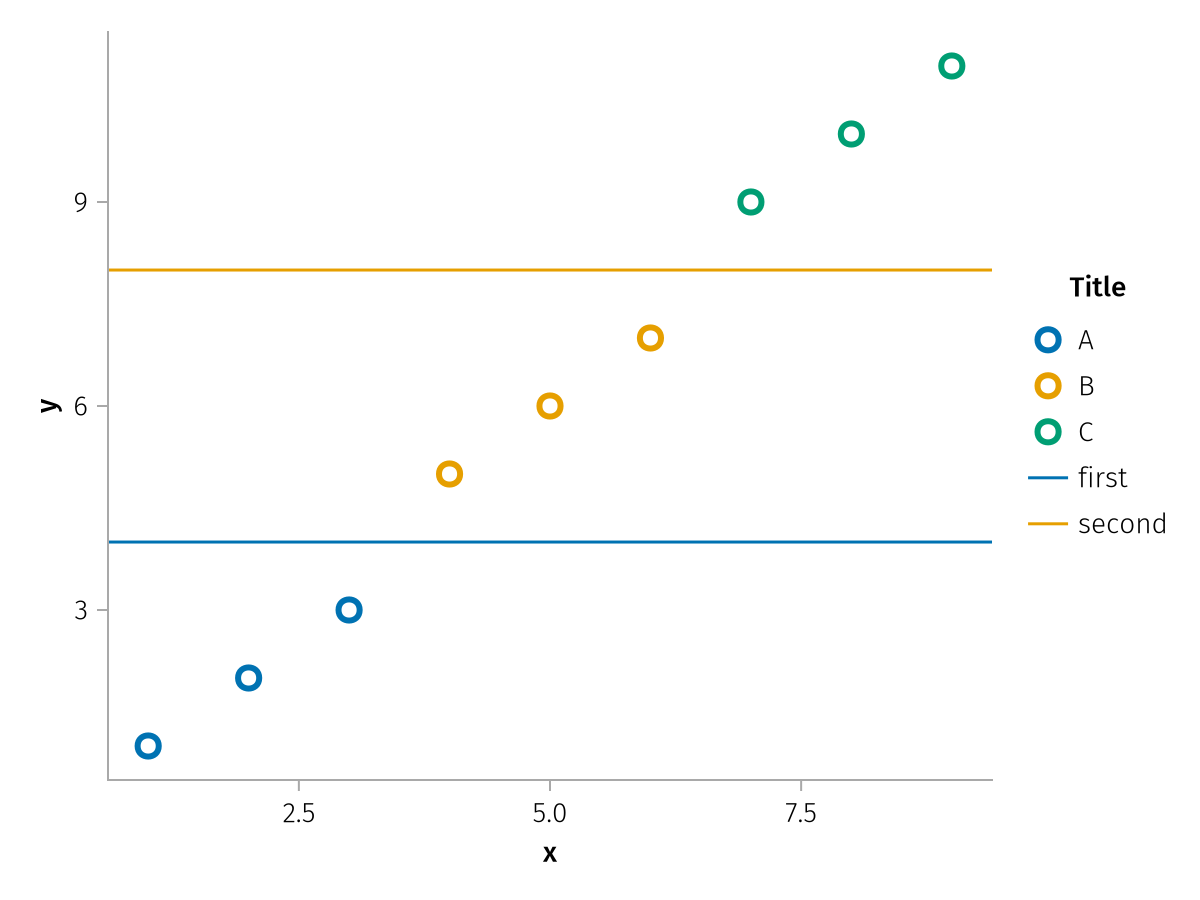
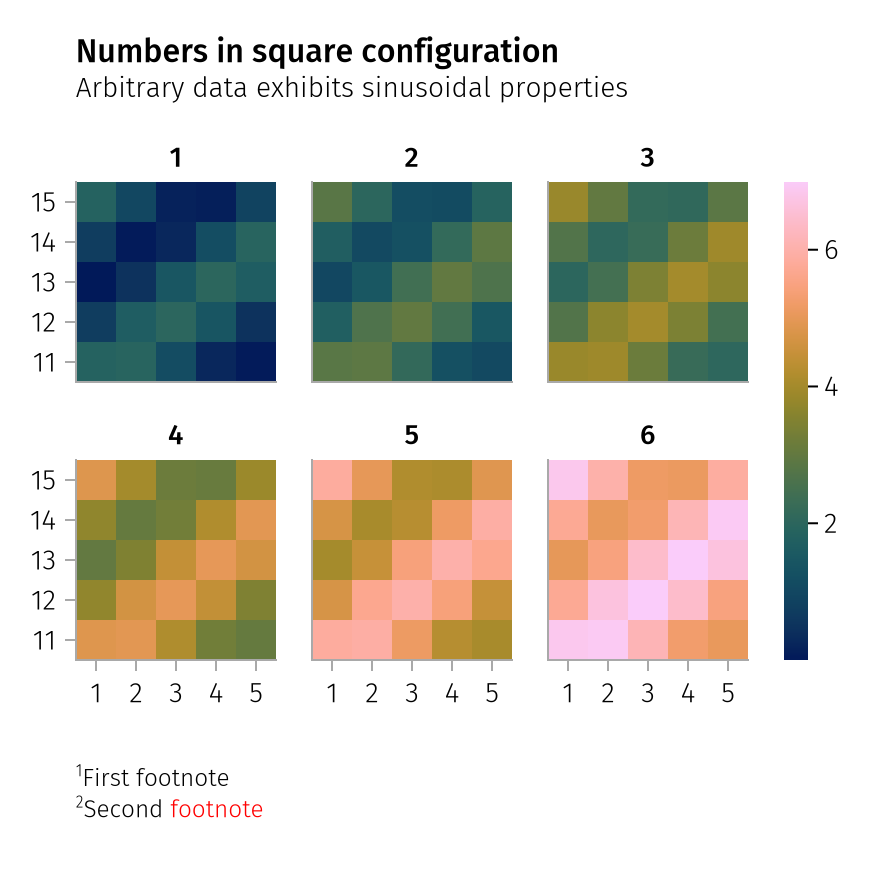
Figure options
AlgebraOfGraphics can add a title, subtitle and footnotes to a figure automatically. Settings for these must be passed to the figure keyword. Check the draw function for a complete list.
using AlgebraOfGraphics
using CairoMakie

spec = pregrouped(
    fill(1:5, 6),
    fill(11:15, 6),
    [reshape(sin.(1:25), 5, 5) .+ i for i in 1:6],
    layout = 1:6 => nonnumeric) * visual(Heatmap)

draw(
    spec;
    figure = (;
        title = "Numbers in square configuration",
        subtitle = "Arbitrary data exhibits sinusoidal properties",
        footnotes = [
            rich(superscript("1"), "First footnote"),
            rich(superscript("2"), "Second ", rich("footnote", color = :red)),
        ],
    ),
    axis = (; width = 100, height = 100)
)