Using mapping without tabular data
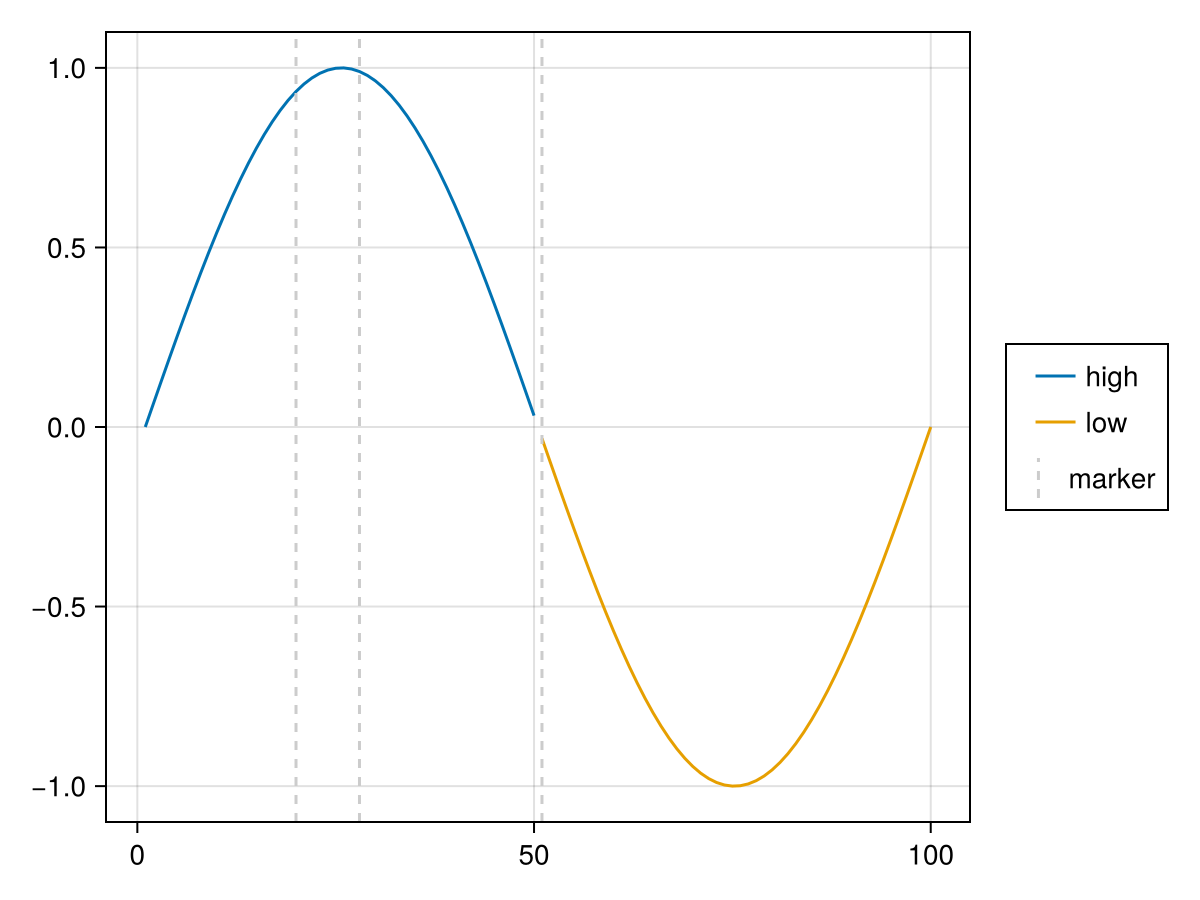
Sometimes it's easier to specify columnar data directly within mapping rather than first storing it in some tabular data source and accessing it by column name. Note that you can also use scalar values which will be treated like columns with repeated elements. In the example below, we specify color = "marker" instead of the more verbose color = fill("marker", 3).
julia
using AlgebraOfGraphics, CairoMakie

x = 1:100
y = sin.(range(0, 2pi, length = 100))

plt = mapping(x, y, color = repeat(["high", "low"], inner = 50)) *
    visual(Lines) +
    mapping([20, 28, 51], color = "marker" => scale(:secondary)) *
    visual(VLines, linestyle = :dash)

fg = draw(plt, scales(secondary = (; palette = [:gray80])))