Density plots
julia
using AlgebraOfGraphics, CairoMakie
using AlgebraOfGraphics: density

df = (x=randn(1000), c=rand(["a", "b"], 1000))
plt = data(df) * mapping(:x, color=:c) * density(bandwidth=0.5)
fg = draw(plt)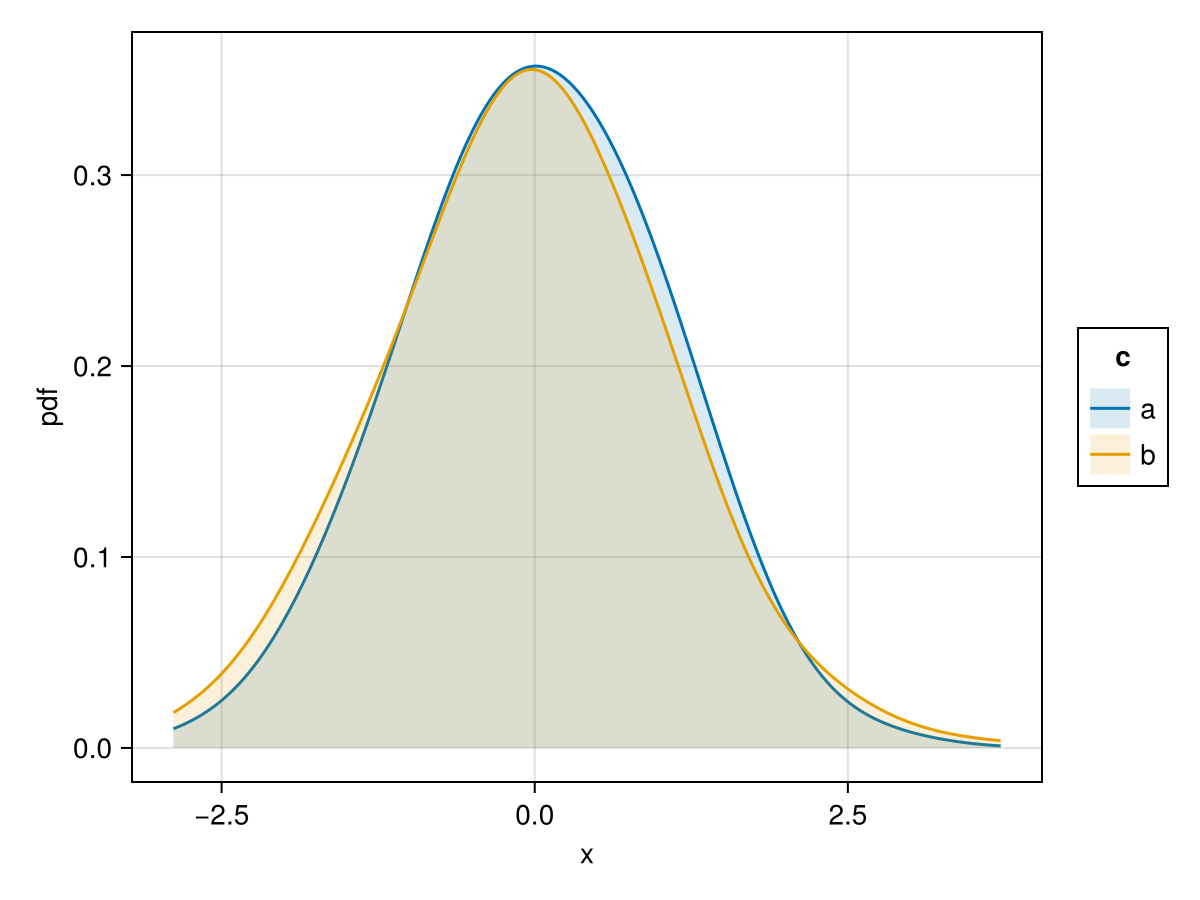
julia
df = (x=randn(1000), c=rand(["a", "b"], 1000))
plt = data(df) * mapping(:x, color=:c) * density(bandwidth=0.5) * visual(orientation=:vertical)
"Not yet supported"