Colorbar options
julia
using AlgebraOfGraphics, CairoMakieTo tweak the position and appearance of the colorbar, simply use the colorbar keyword when plotting. For example
julia
df = (x=rand(100), y=rand(100), z=rand(100))
plt = data(df) * mapping(:x, :y, color=:z)
draw(plt)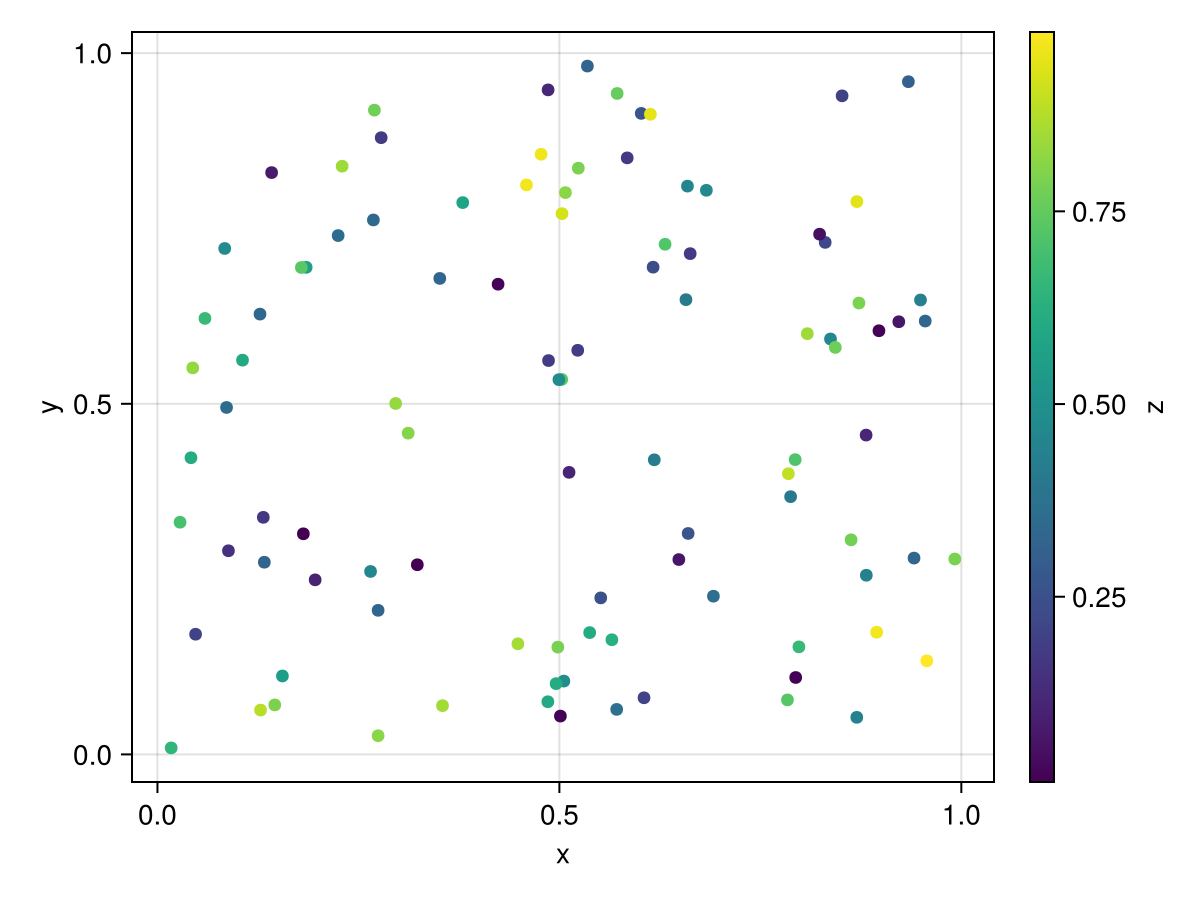
julia
fg = draw(plt, colorbar=(position=:top, size=25))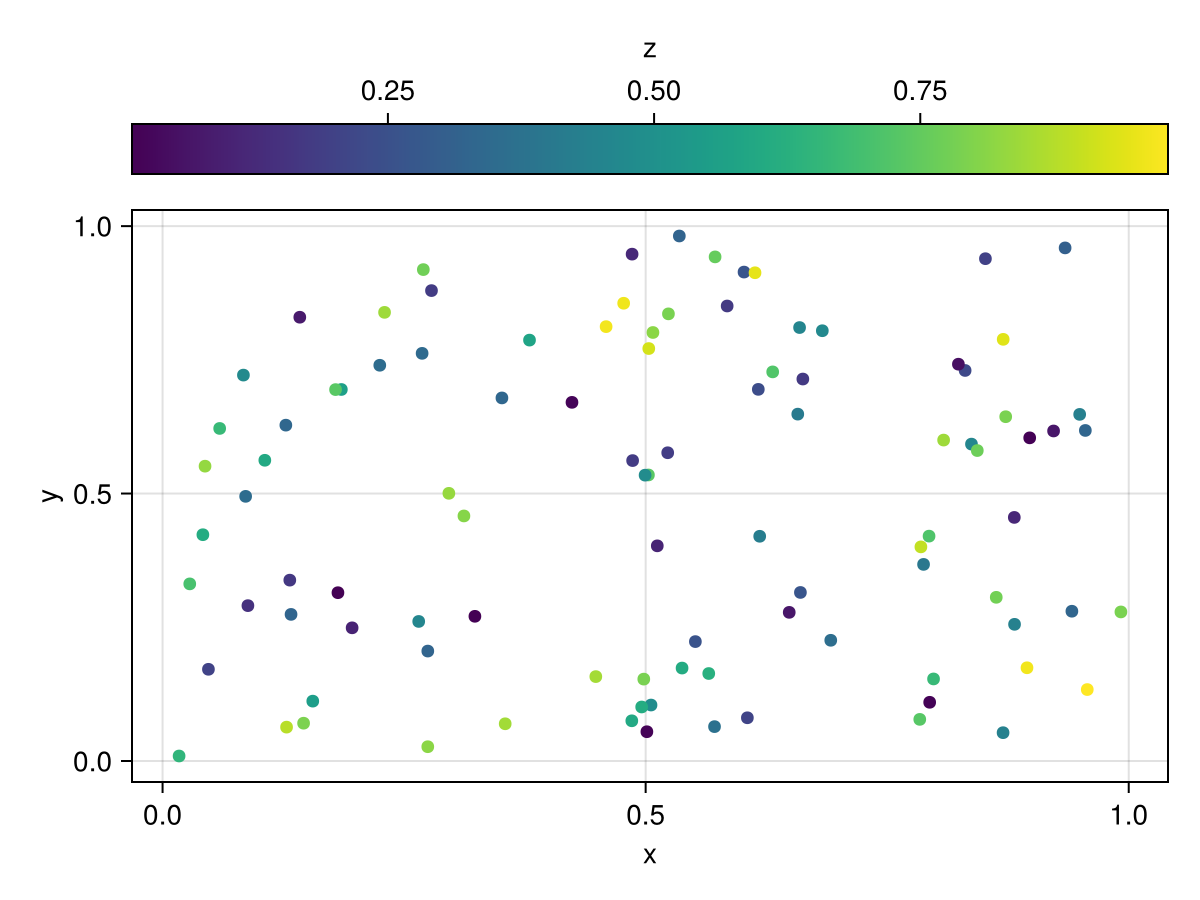
To change the colormap, you have to modify the corresponding scale. Usually, this will be the Color scale.
Note
Before AlgebraOfGraphics v0.7, you would change the colormap by passing it via visual. This was changed so that each color scale, which can be used by multiple plot layers, has a single source of truth for these settings.
julia
draw(plt, scales(Color = (; colormap = :thermal)))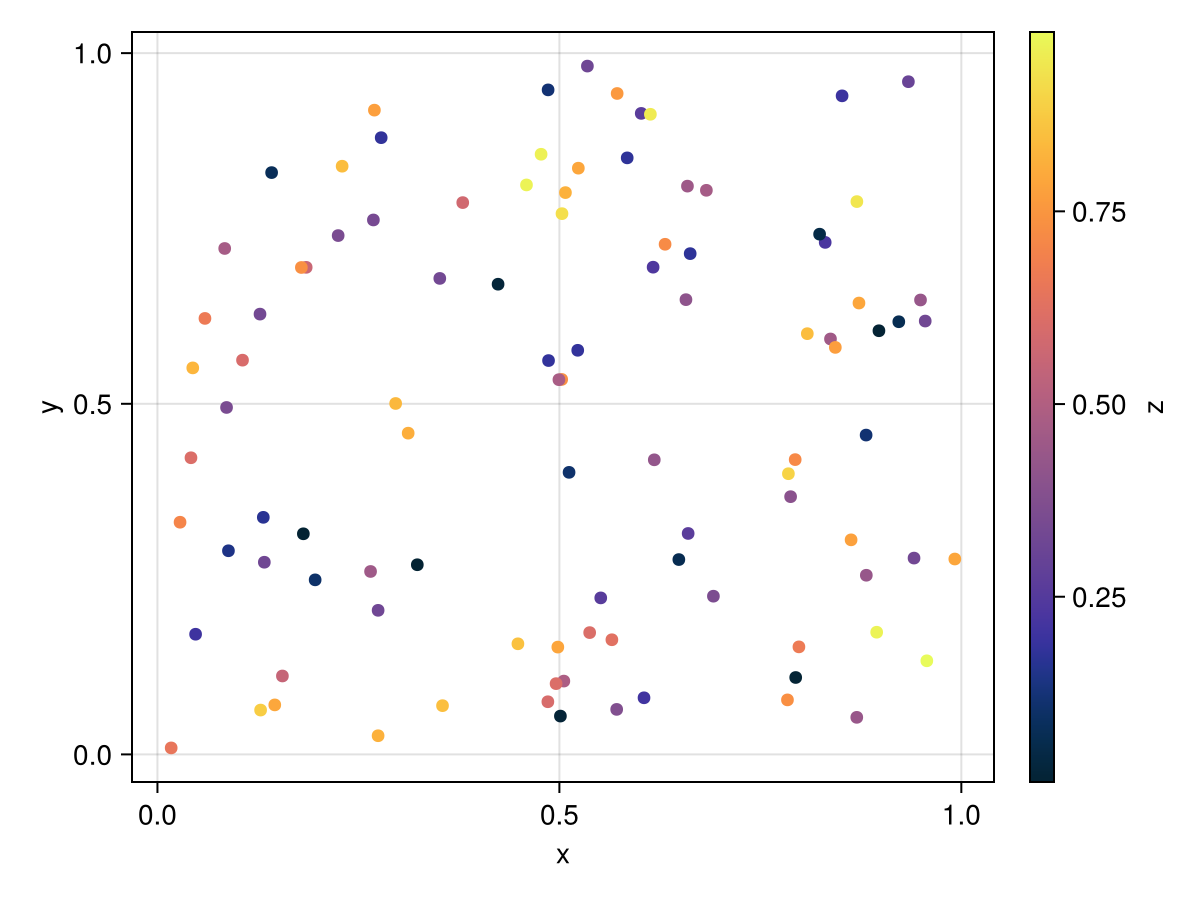
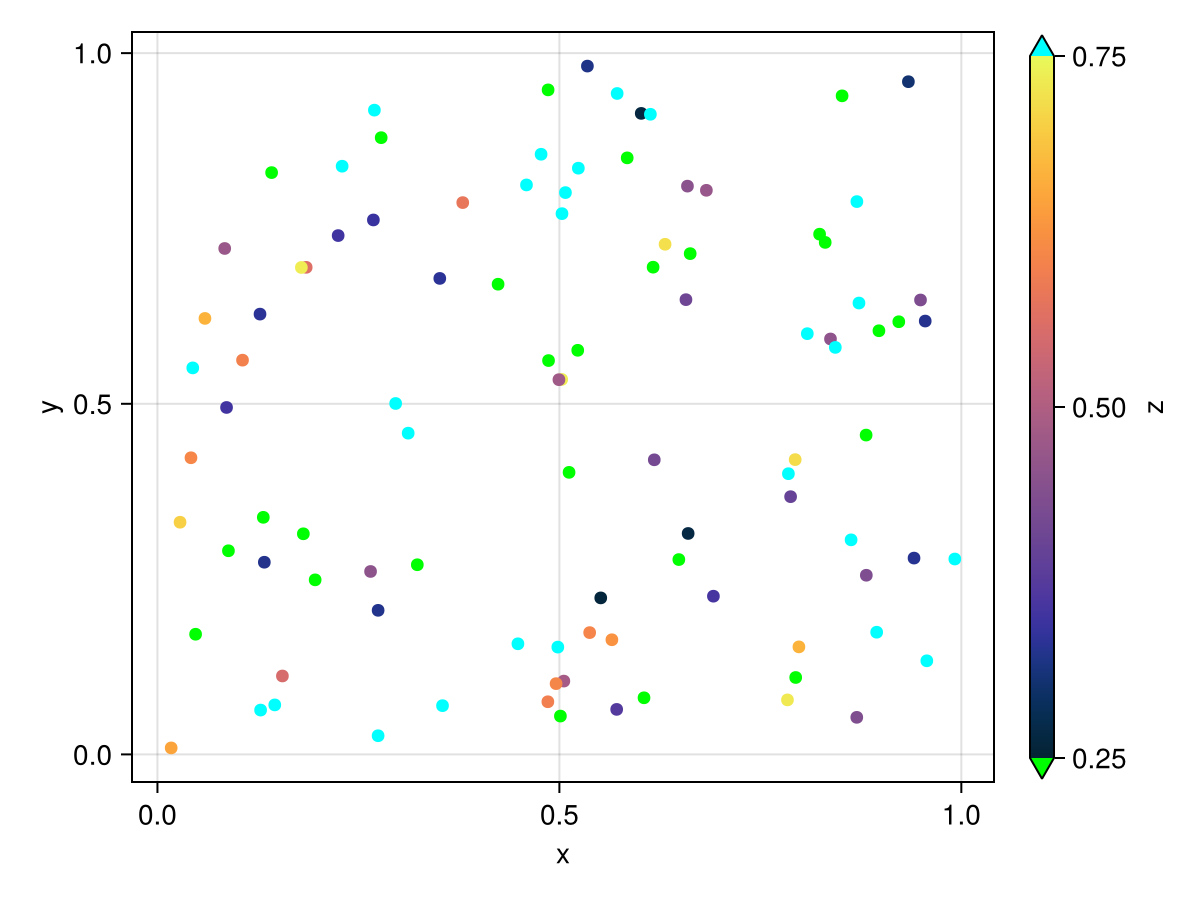
Other continuous color parameters are highclip, lowclip, nan_color and colorrange.
julia
draw(plt, scales(Color = (;
    colormap = :thermal,
    colorrange = (0.25, 0.75),
    highclip = :cyan,
    lowclip = :lime,
)))