Dodging
using AlgebraOfGraphics, CairoMakie
using Colors
Some plot types like barplots natively support a dodge attribute which avoids overlap between groups that share the same coordinates.
df = (; x = ["One", "One", "Two", "Two"], y = 1:4, err = [0.2, 0.3, 0.4, 0.5], group = ["A", "B", "A", "B"])
plt = data(df) * mapping(:x, :y, dodge = :group, color = :group) * visual(BarPlot)
draw(plt)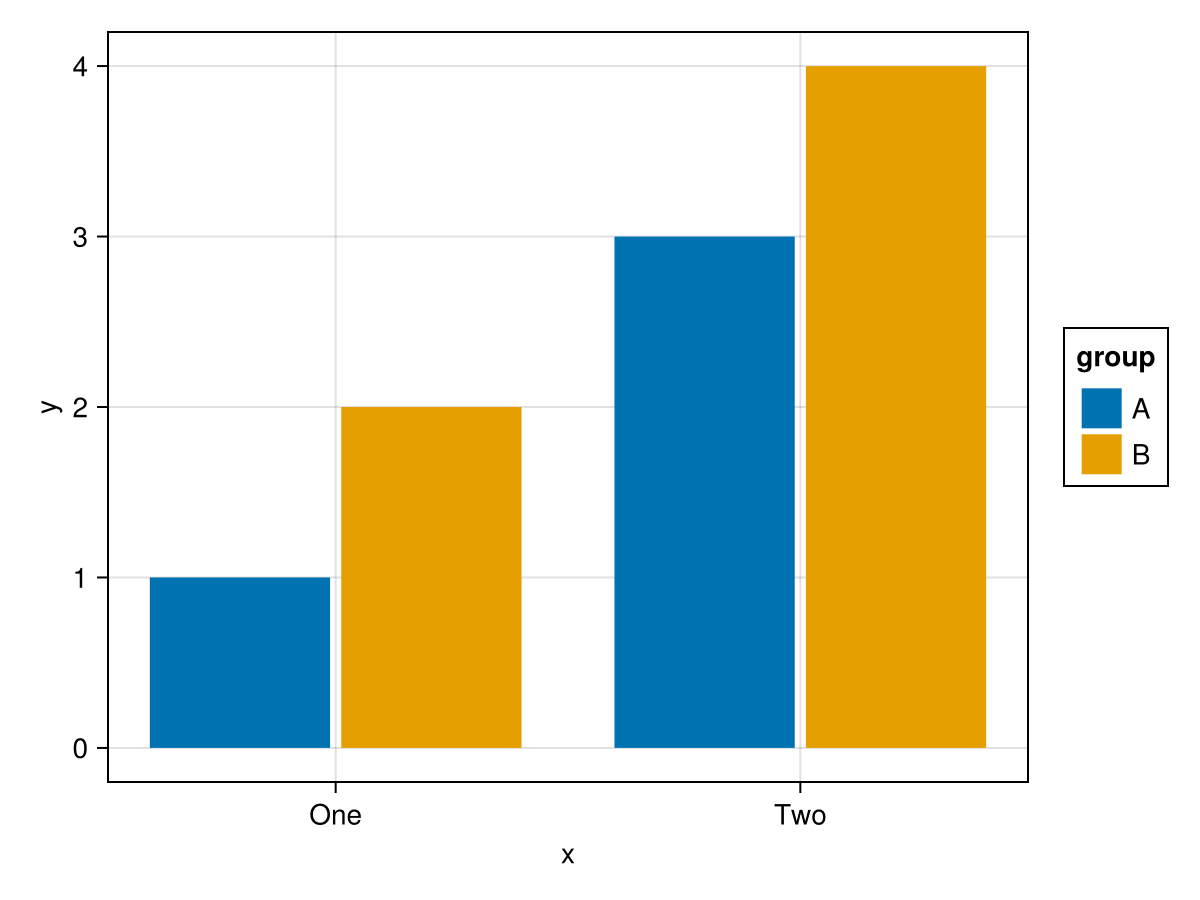
Other plot types like errorbars do not have a dodge keyword, however you can dodge them using AlgebraOfGraphic's hardcoded dodge_x or dodge_y mappings. These will only shift the data away from the category centers but will not change other plot attributes (like dodging a barplot makes narrower bars). They are therefore mostly appropriate for "width-less" plot types like scatters or errorbars.
If you combine errorbars with a barplot, AlgebraOfGraphics will apply the barplot's dodge width to the errorbars automatically so they match:
plt2 = data(df) * mapping(:x, :y, :err, dodge_x = :group) * visual(Errorbars)
fg = draw(plt + plt2)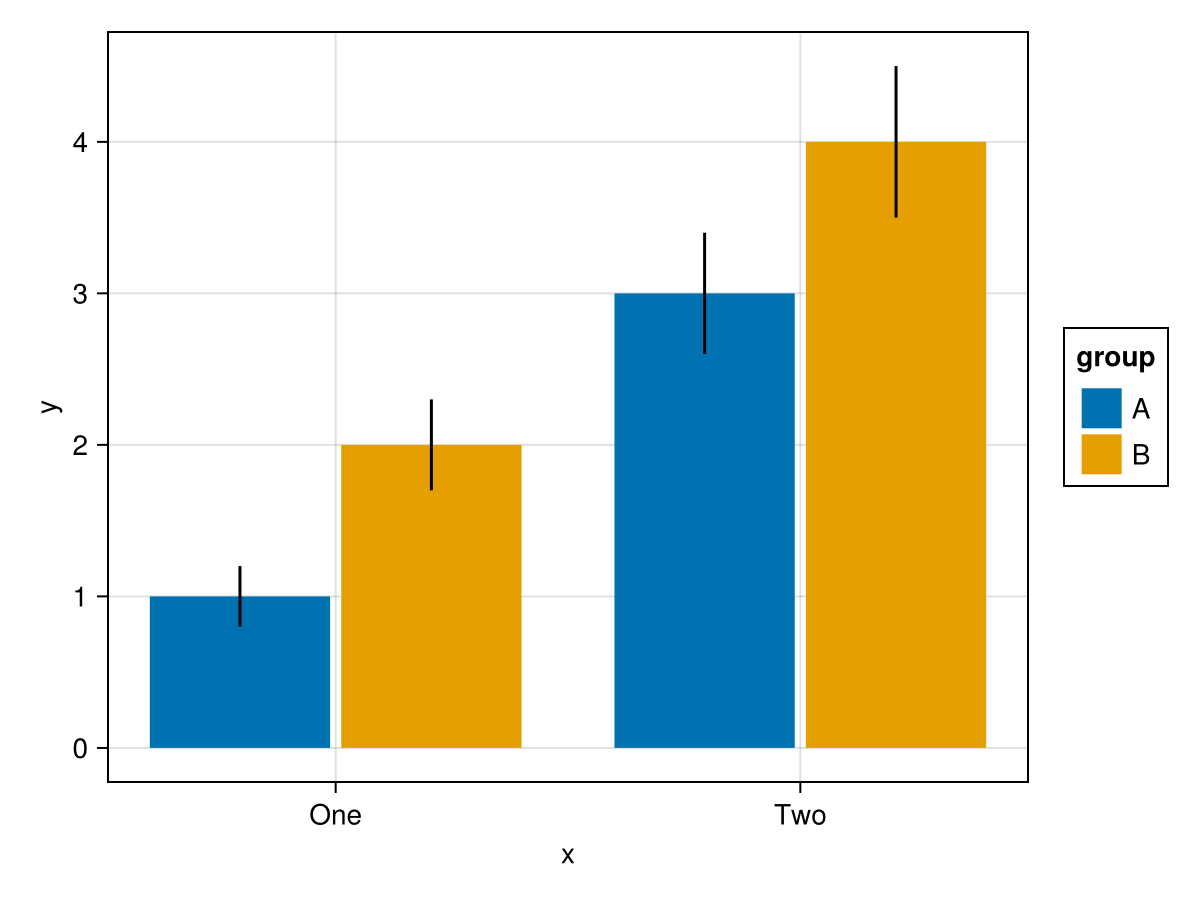
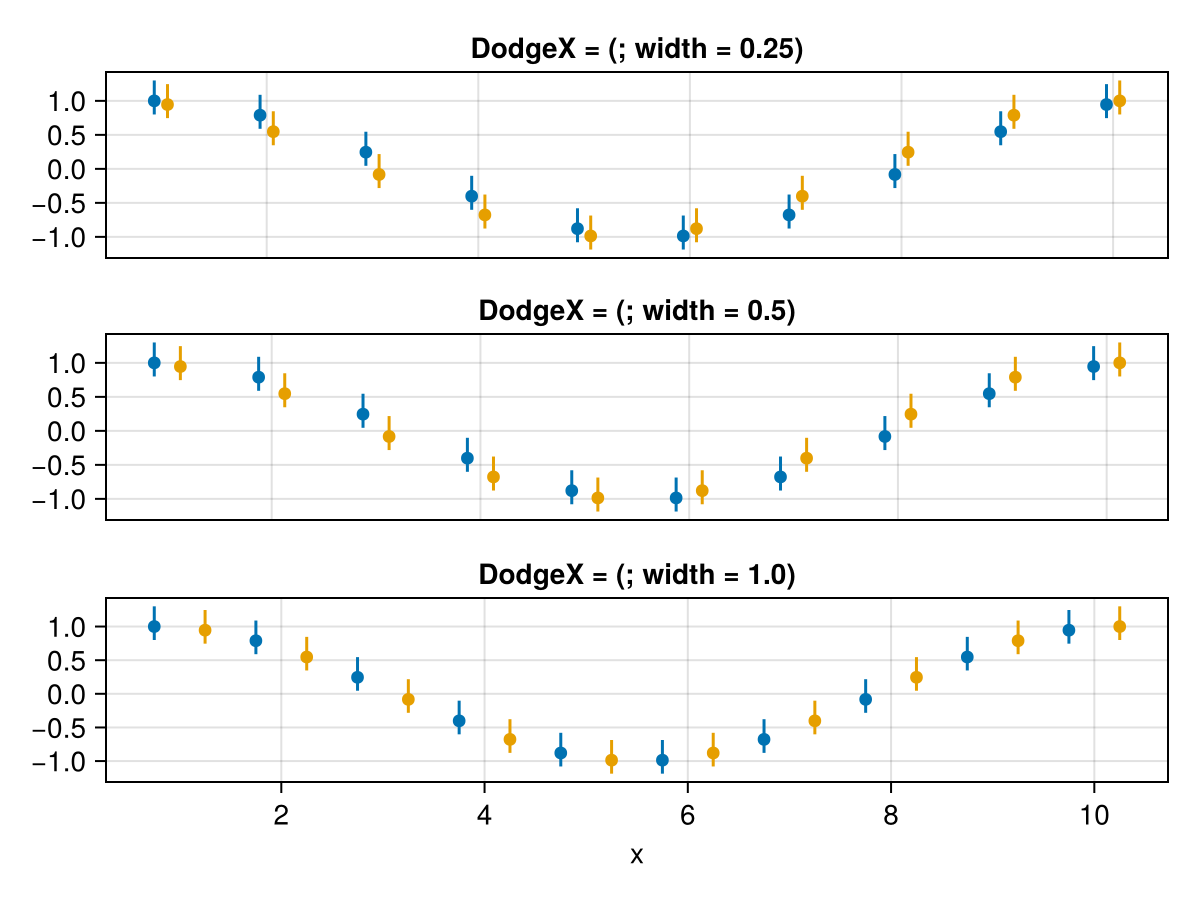
If you only use "width-less" plot types, you will get an error if you don't set a dodge width manually. You can do so via the scales function:
df = (
    x = repeat(1:10, inner = 2),
    y = cos.(range(0, 2pi, length = 20)),
    ylow = cos.(range(0, 2pi, length = 20)) .- 0.2,
    yhigh = cos.(range(0, 2pi, length = 20)) .+ 0.3,
    dodge = repeat(["A", "B"], 10)
)

f = Figure()
plt3 = data(df) * (
    mapping(:x, :y, dodge_x = :dodge, color = :dodge) * visual(Scatter) +
    mapping(:x, :ylow, :yhigh, dodge_x = :dodge, color = :dodge) * visual(Rangebars)
)
kw(; kwargs...) = (; xticklabelsvisible = false, xticksvisible = false, xlabelvisible = false, kwargs...)

draw!(f[1, 1], plt3, scales(DodgeX = (; width = 0.25)); axis = kw(title = "DodgeX = (; width = 0.25)"))
draw!(f[2, 1], plt3, scales(DodgeX = (; width = 0.5)); axis = kw(title = "DodgeX = (; width = 0.5)"))
draw!(f[3, 1], plt3, scales(DodgeX = (; width = 1.0)); axis = (; title = "DodgeX = (; width = 1.0)"))

f