Lines and markers
A simple scatter plot
julia
using AlgebraOfGraphics, CairoMakie

df = (x=rand(100), y=rand(100))
xy = data(df) * mapping(:x, :y)
draw(xy)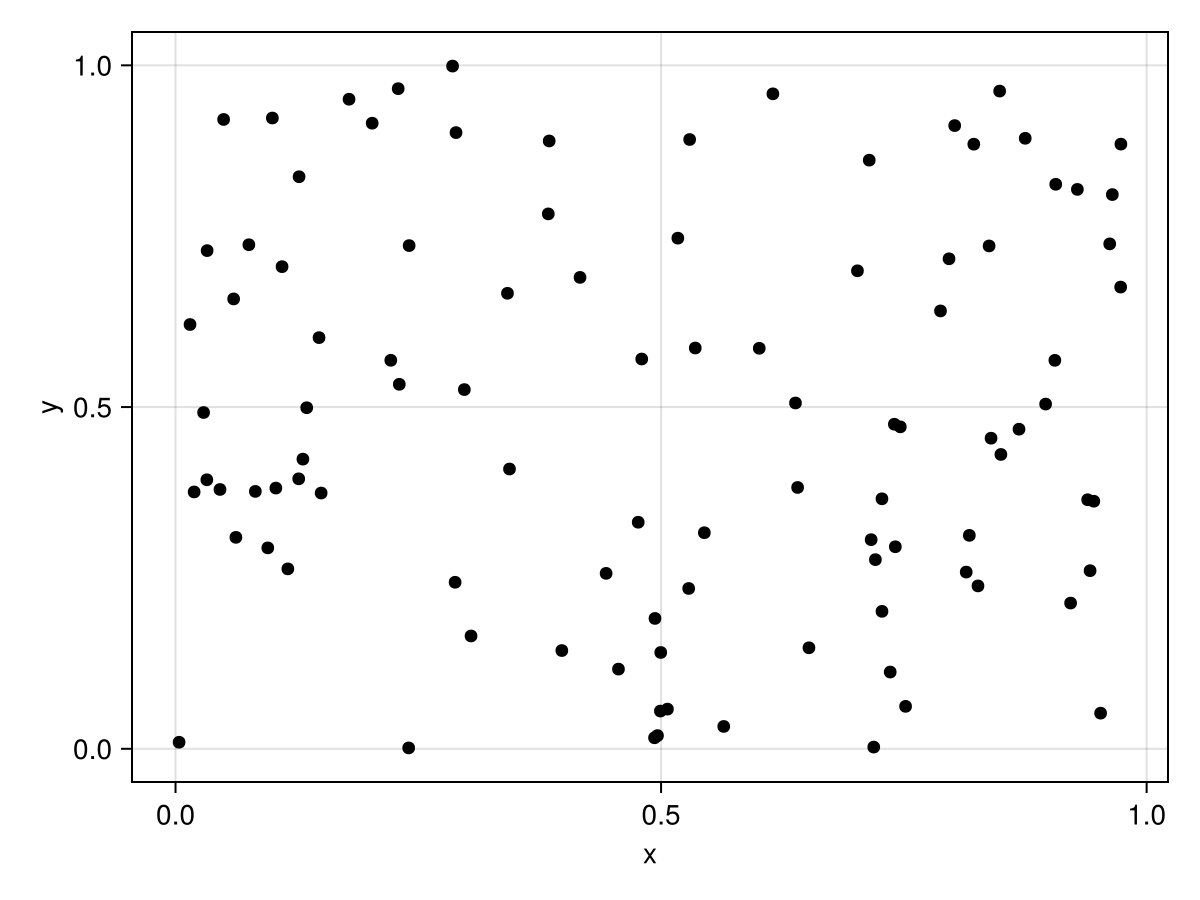
A simple lines plot
julia
x = range(-π, π, length=100)
y = sin.(x)
df = (; x, y)
xy = data(df) * mapping(:x, :y)
layer = visual(Lines)
draw(layer * xy)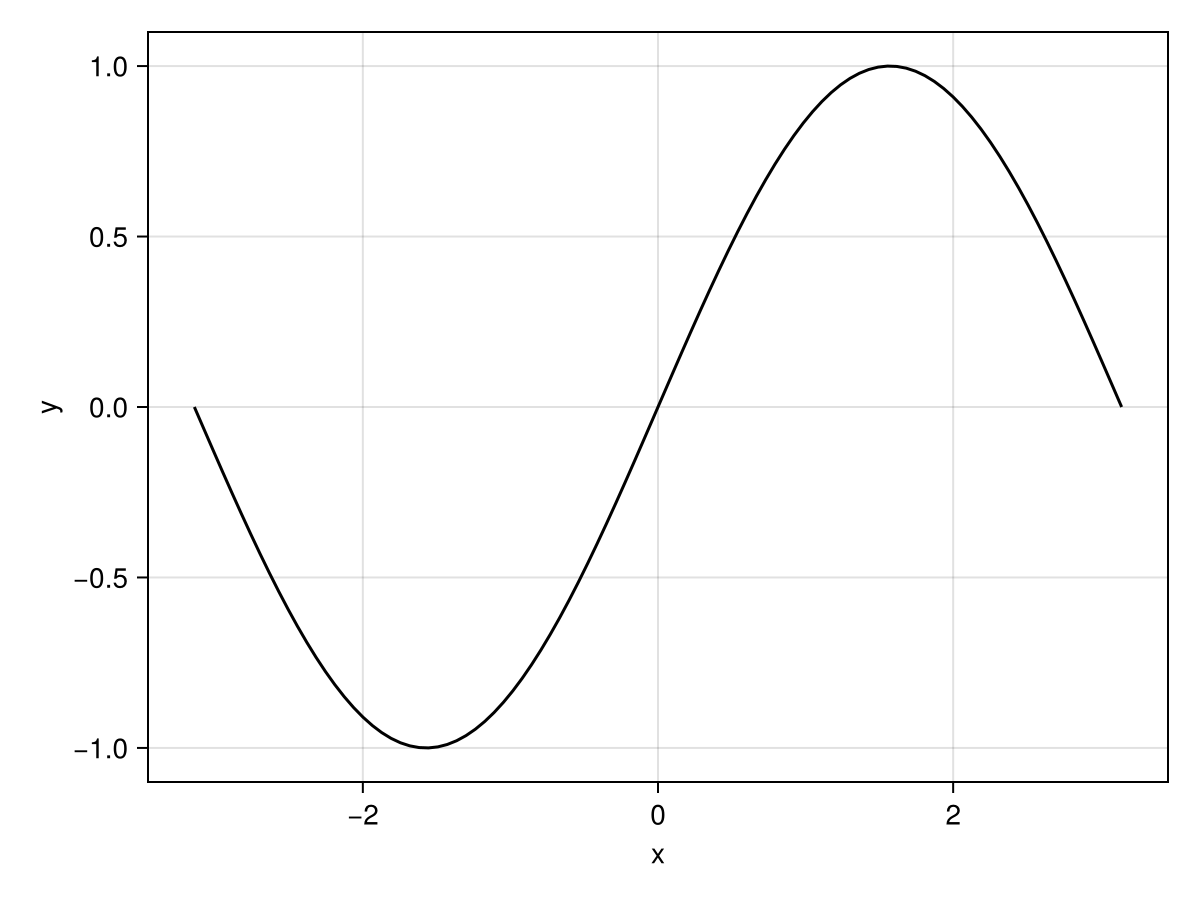
Lines and scatter combined plot
julia
x = range(-π, π, length=100)
y = sin.(x)
df = (; x, y)
xy = data(df) * mapping(:x, :y)
layers = visual(Scatter) + visual(Lines)
draw(layers * xy)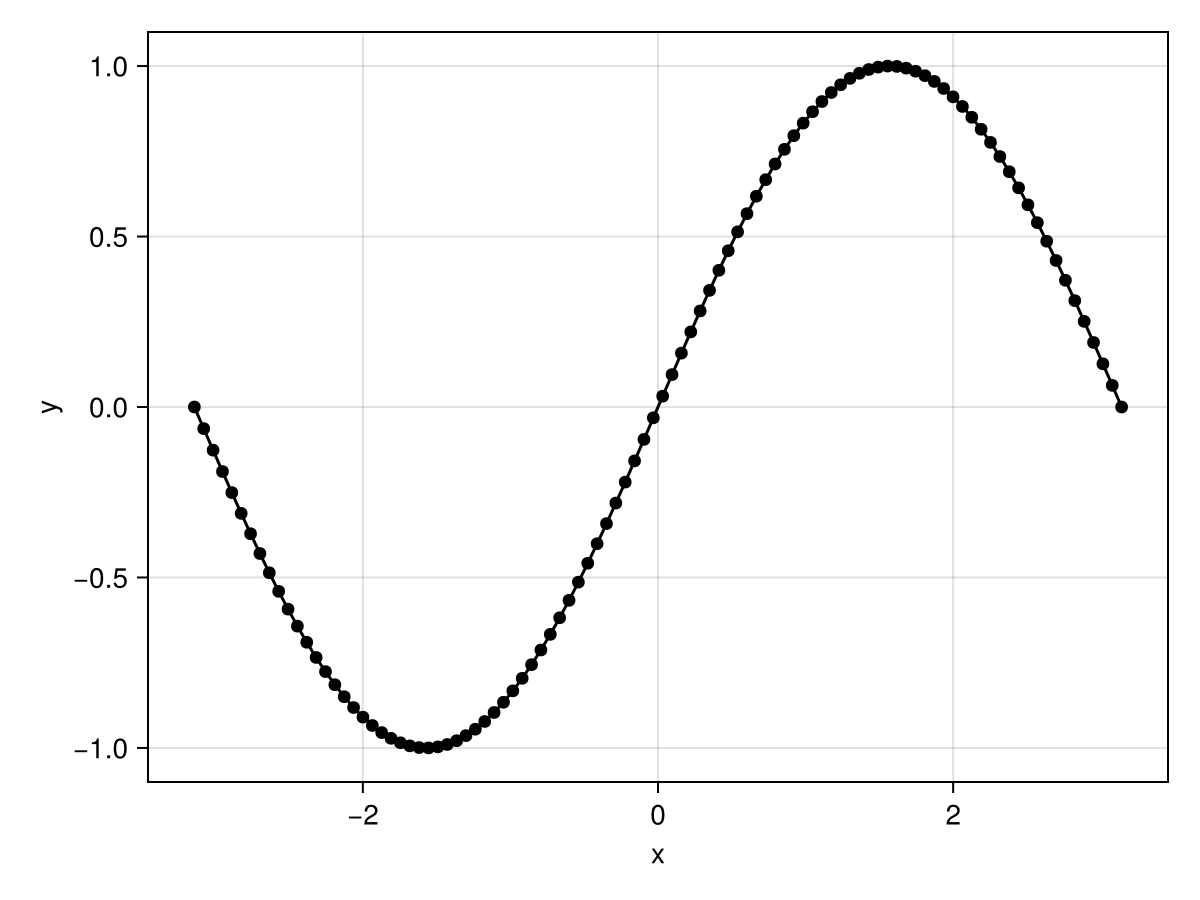
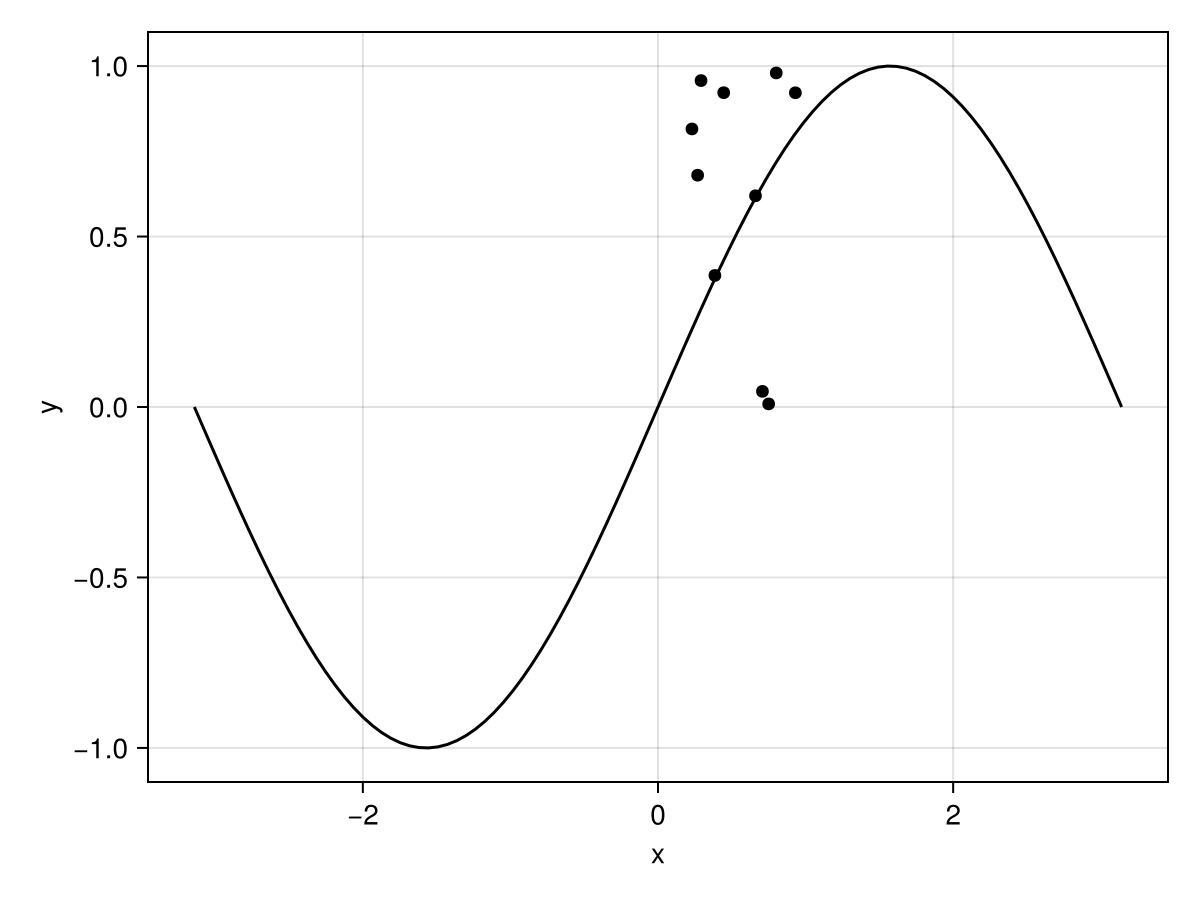
julia
x = range(-π, π, length=100)
y = sin.(x)
df1 = (; x, y)
df2 = (x=rand(10), y=rand(10))
layers = data(df1) * visual(Lines) + data(df2) * visual(Scatter)
fg = draw(layers * mapping(:x, :y))