Faceting
julia
using AlgebraOfGraphics, CairoMakieFacet grid
julia
df = let
    N = 100
    x0 = rand(1:10, N)
    i = rand(["α", "β"], N)
    j = rand(["a", "b", "c"], N)

    x = map(zip(x0, j)) do (xx, jj)
        shift = jj == "a" ? -2.9 : jj == "c" ? 2.9 : 0.0
        xx + shift
    end

    y = map(zip(x0, i)) do (xx, ii)
        shift = ii == "α" ? -3.9 : 3.9
        xx + 2 + shift + rand()
    end

    (; x, y, i, j)
end

plt = data(df) * mapping(:x, :y, row=:i, col=:j)

draw(plt)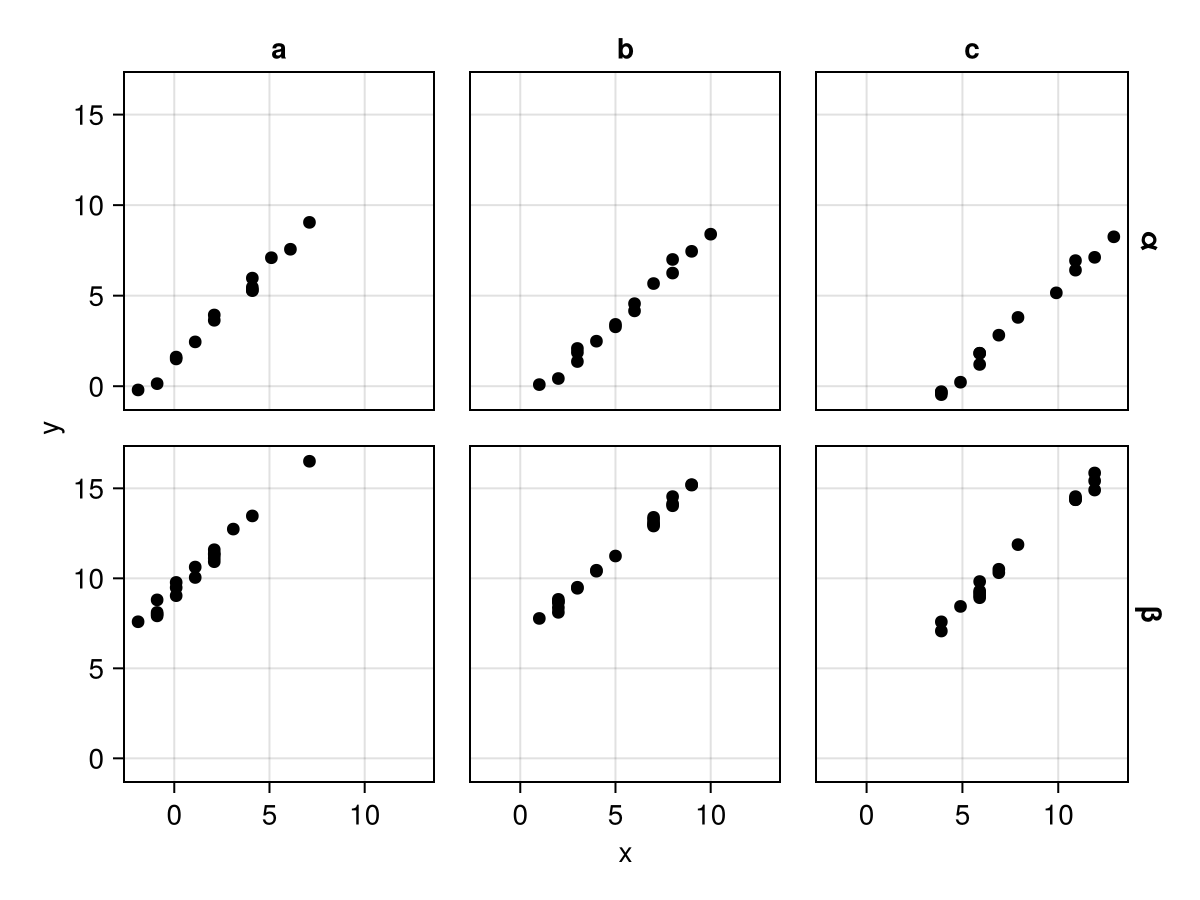
Facet grid with minimal axes linking needed to remove ticks
julia
draw(plt, facet=(; linkxaxes=:minimal, linkyaxes=:minimal))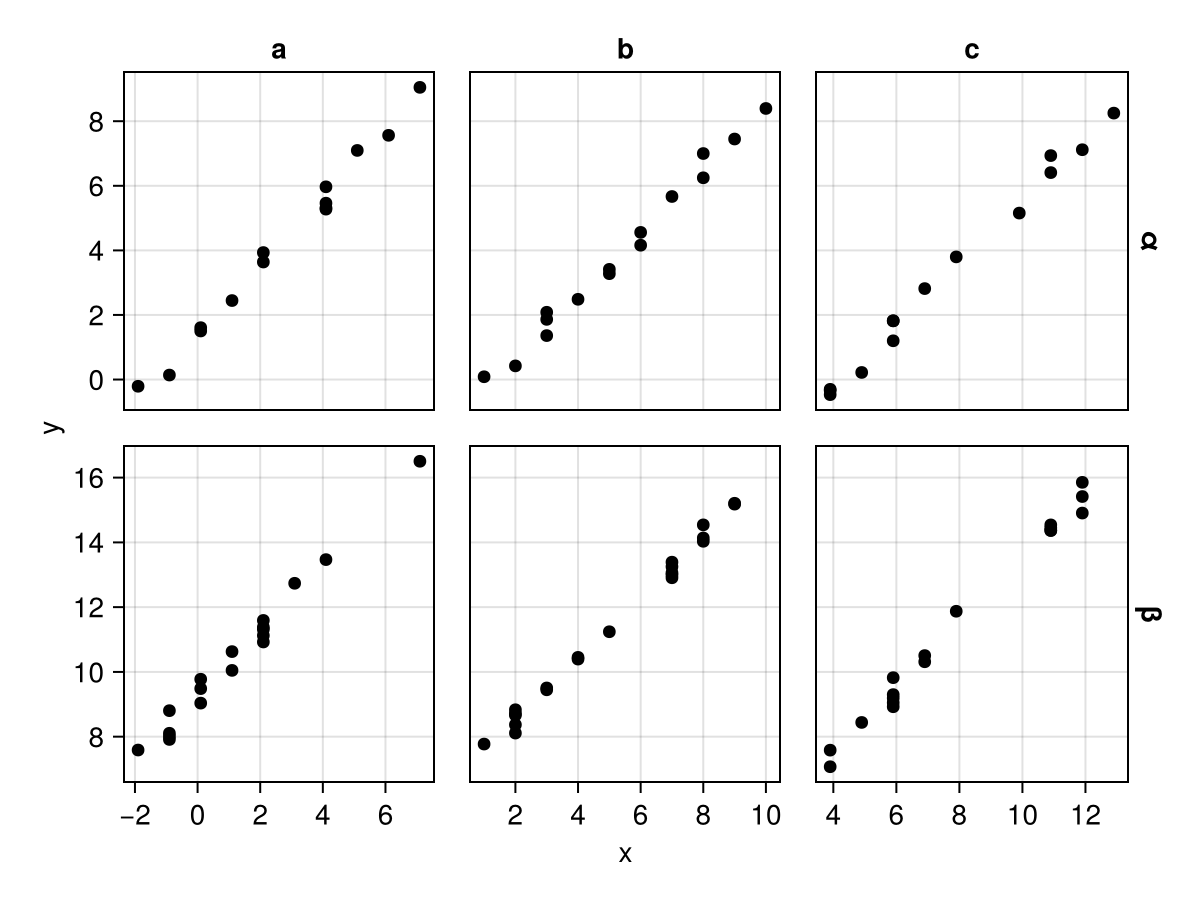
Facet grid with unlinked x-axes
julia
draw(plt, facet=(; linkxaxes=:none))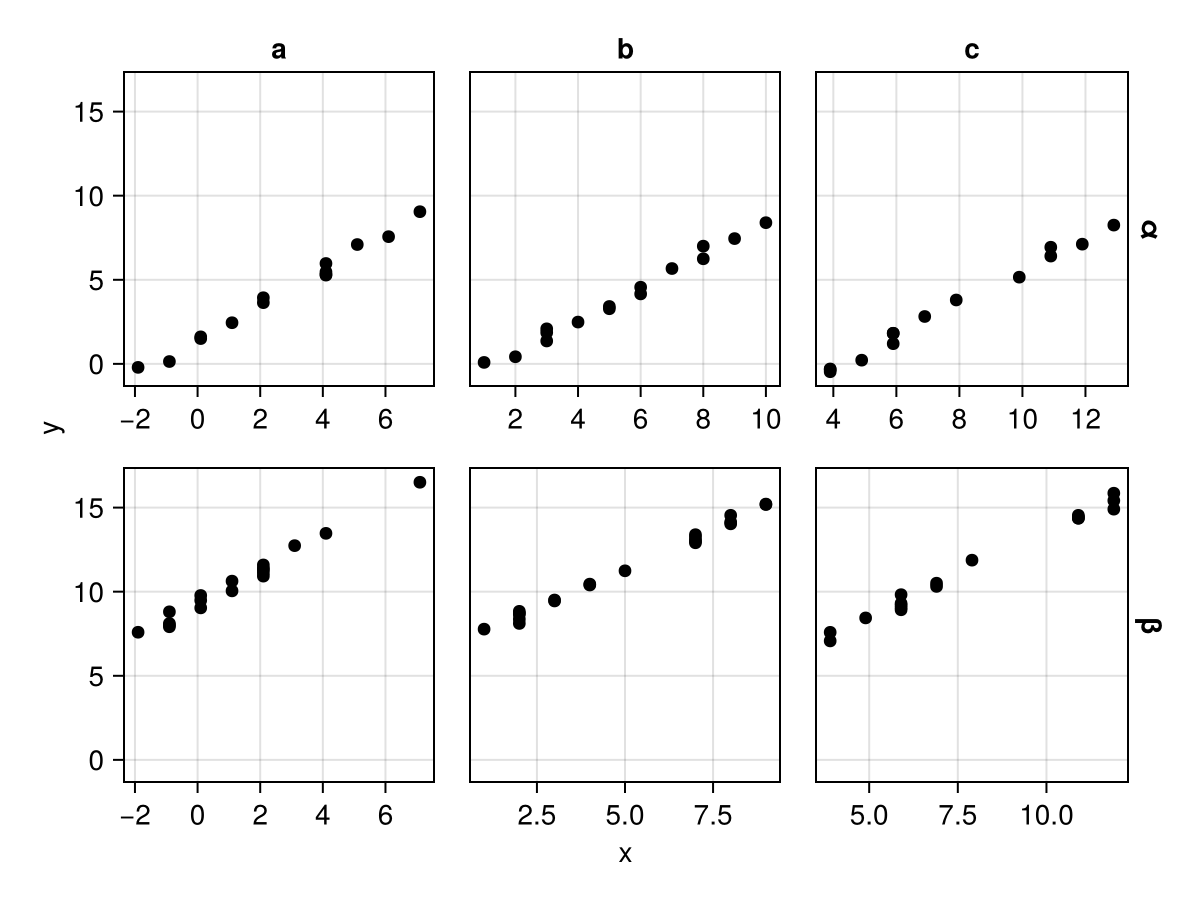
Facet wrap
julia
df = (x=rand(100), y=rand(100), l=rand(["a", "b", "c", "d", "e"], 100))
plt = data(df) * mapping(:x, :y, layout=:l)
draw(plt)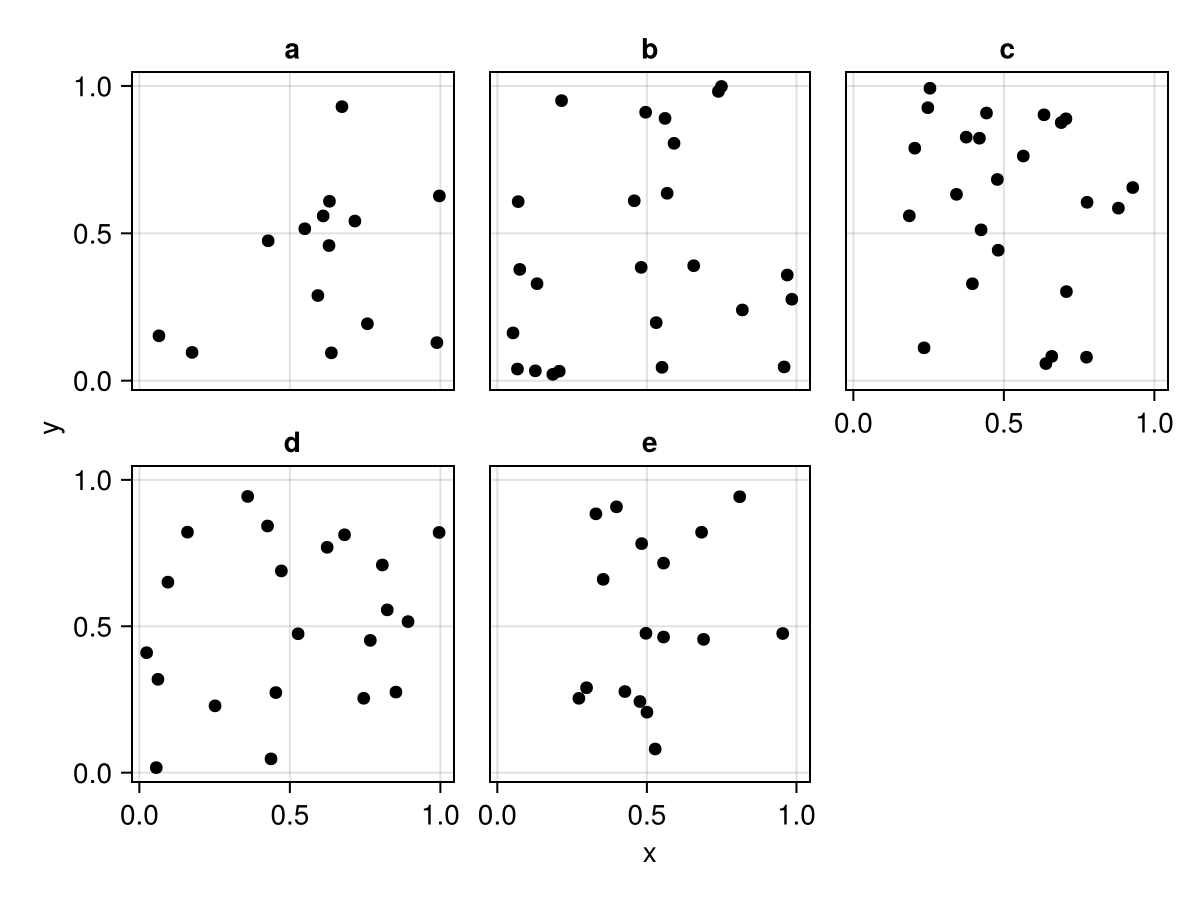
Facet wrap with unlinked axes
julia
draw(plt, facet=(; linkxaxes=:none, linkyaxes=:none))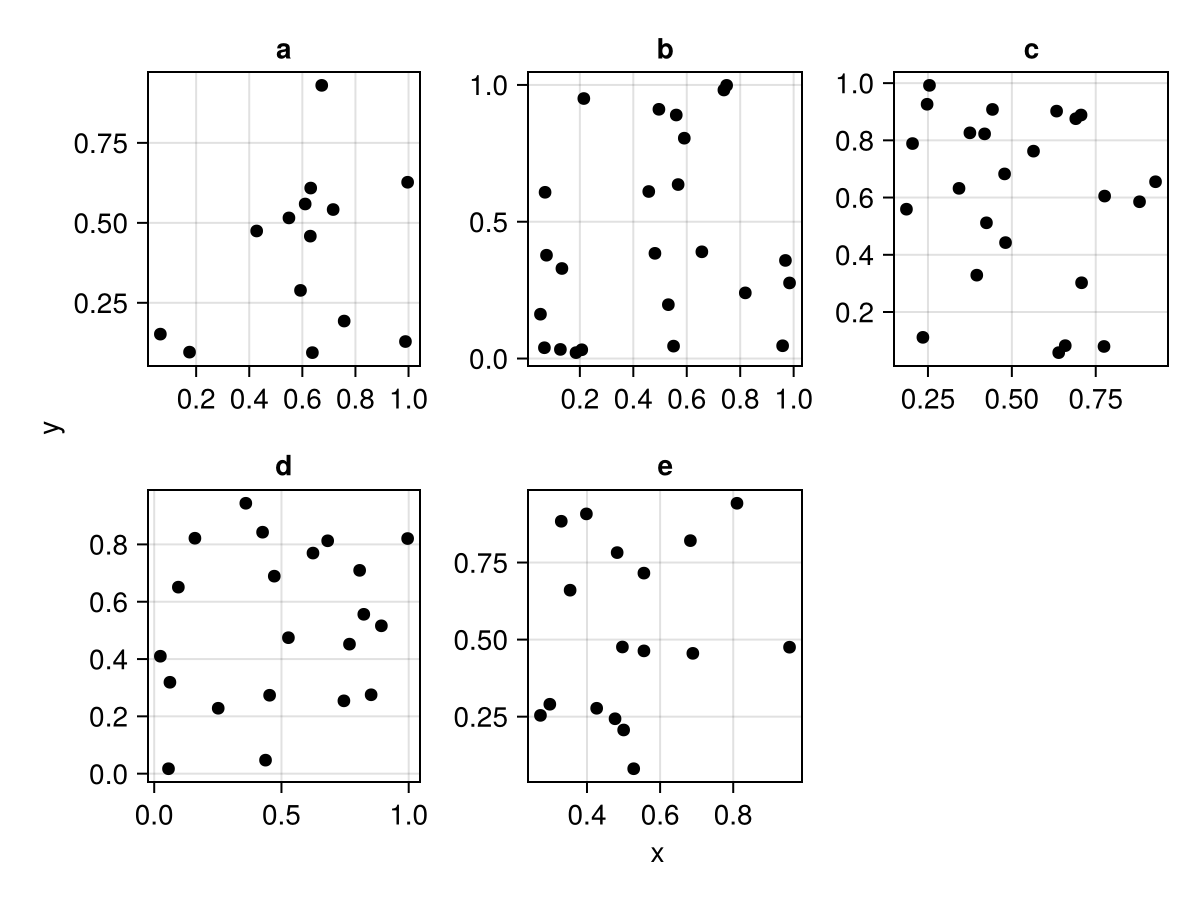
Facet wrap with specified layout for rows and cols
julia
draw(plt, scales(Layout = (; palette = [(1, 1), (2, 1), (3, 1), (1, 2), (2, 2)])))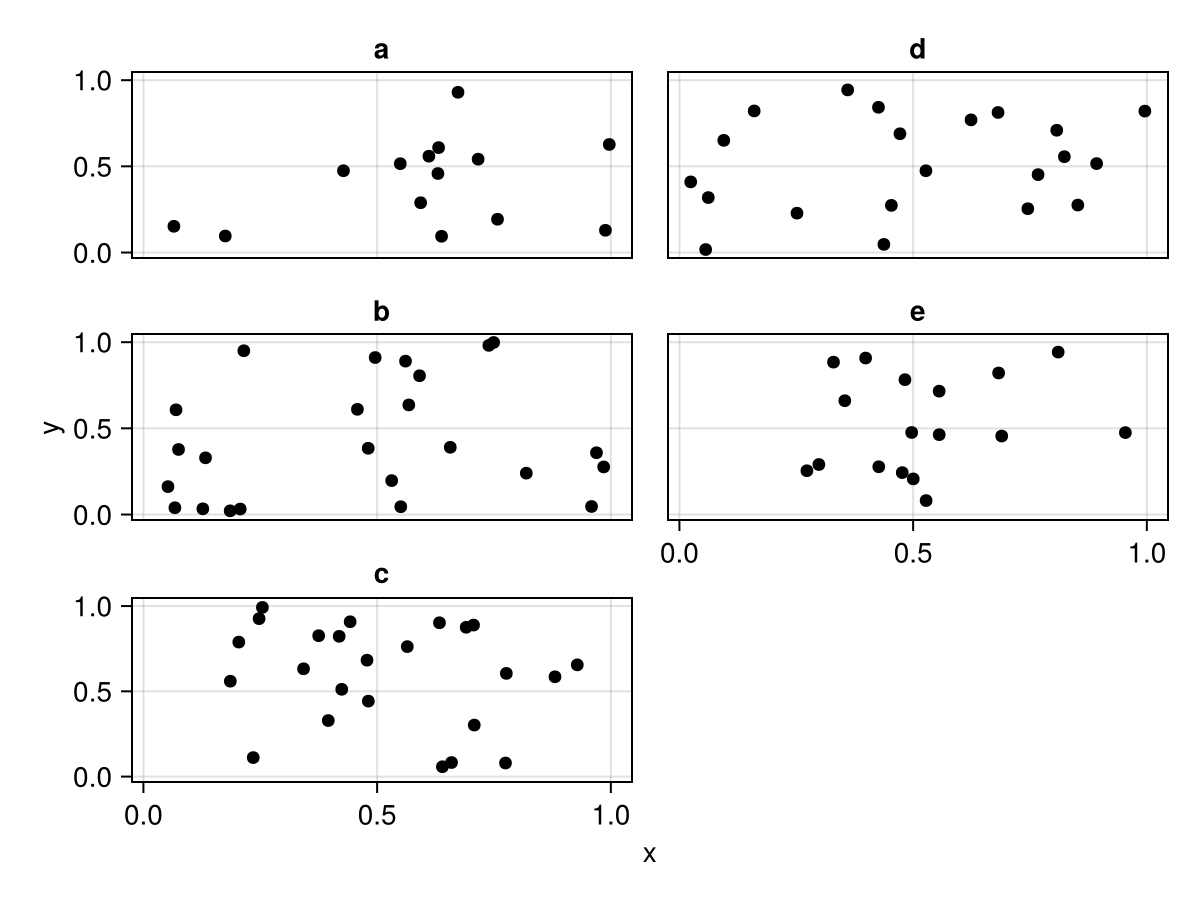
Adding traces to only some subplots
julia
df1 = (x=rand(100), y=rand(100), i=rand(["a", "b", "c"], 100), j=rand(["d", "e", "f"], 100))
df2 = (x=[0, 1], y=[0.5, 0.5], i=fill("a", 2), j=fill("e", 2))
layers = data(df1) * visual(Scatter) + data(df2) * visual(Lines)
fg = draw(layers * mapping(:x, :y, col=:i, row=:j))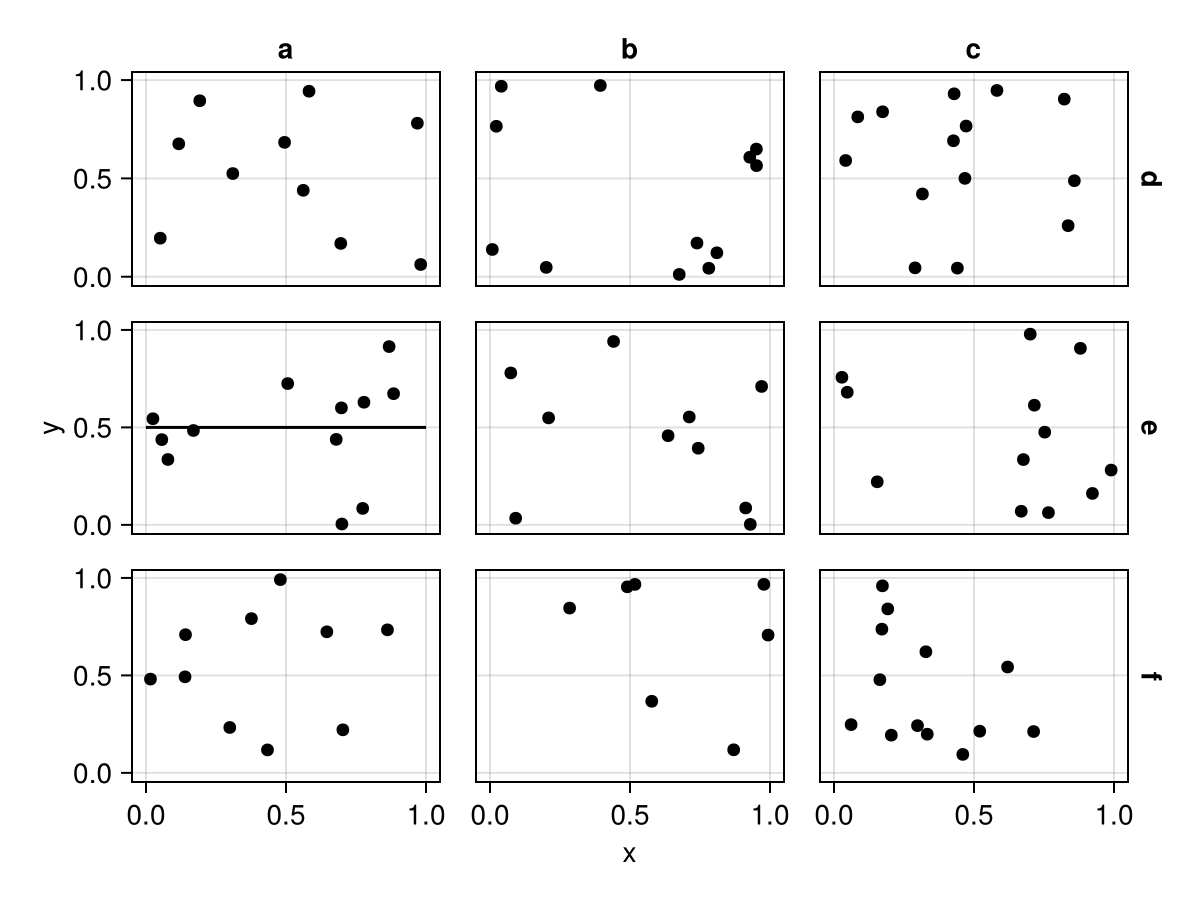
Caveats
The faceting variable must be non-numeric. If the source is numeric, you can convert it with nonnumeric.
julia
df = (x=rand(100), y=rand(100), l=rand([1, 2, 3, 4, 5], 100))
plt = data(df) * mapping(:x, :y, layout=:l => nonnumeric)
draw(plt)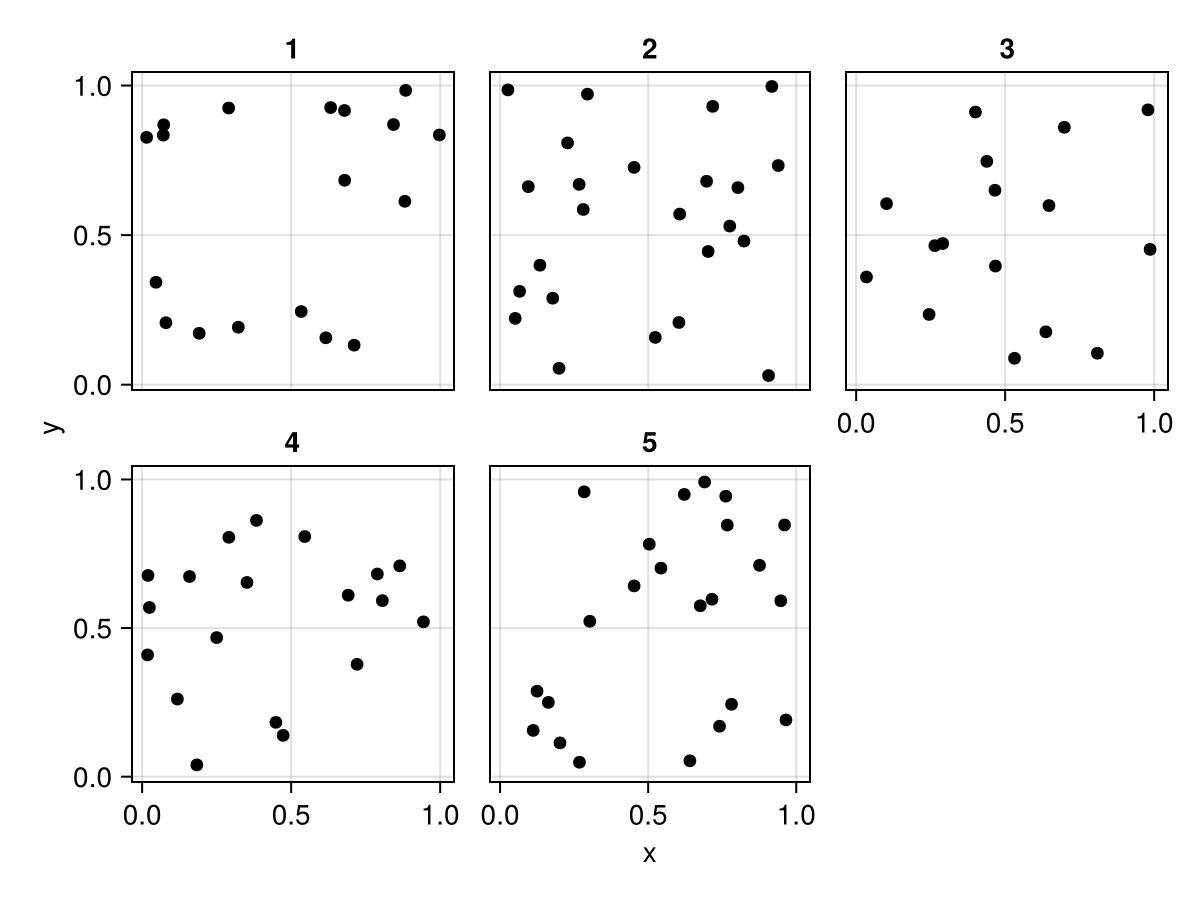
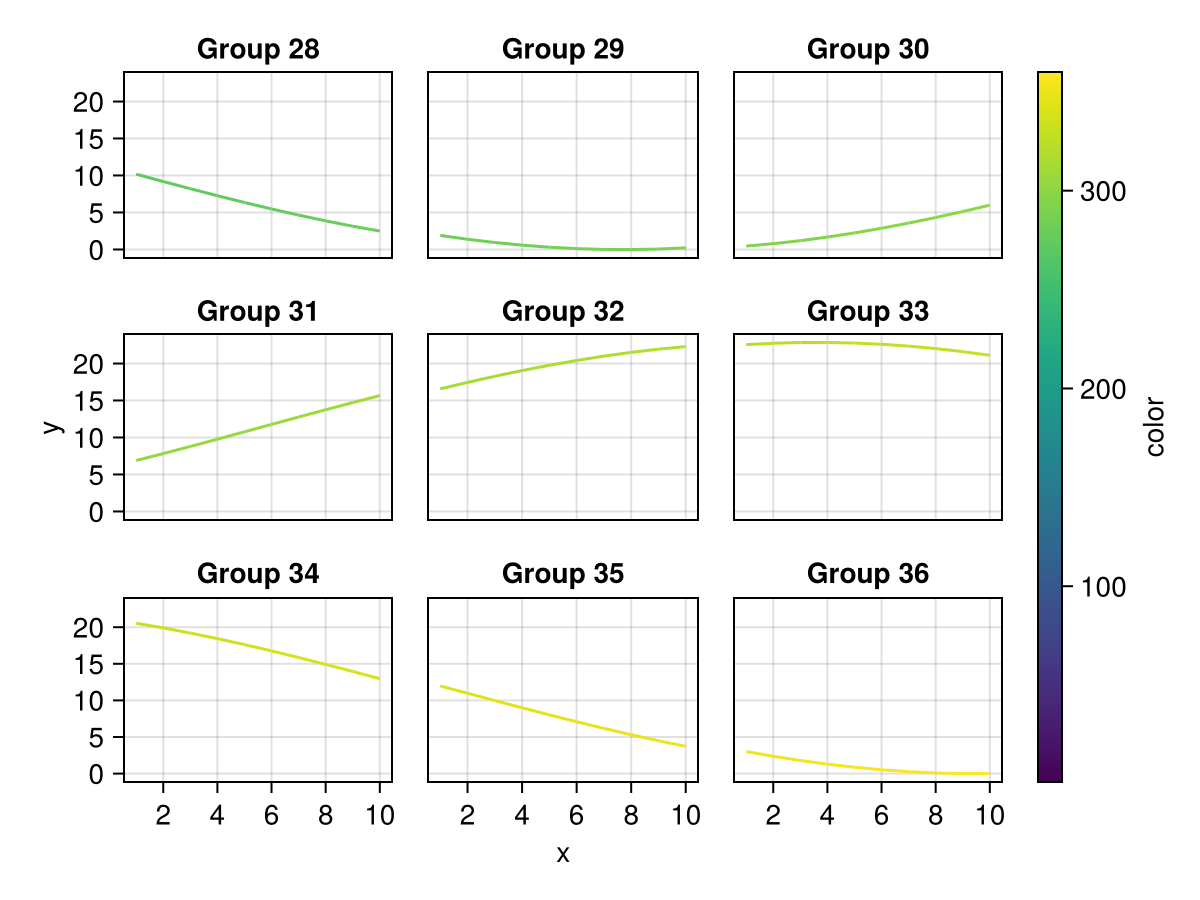
Pagination
If you have too many facets for one figure, you can use paginate to split the data into several subsets given a maximum number of plots per layout, row or column.
We start with a normal facet plot, in this case a wrapped layout:
julia
df = (
    x = repeat(1:10, 36),
    y = cumsum(sin.(range(0, 10pi, 360))),
    group = repeat(string.("Group ", 1:36), inner = 10),
    color = 1:360,
)
plt = data(df) * mapping(:x, :y, color = :color, layout=:group) * visual(Lines)
draw(plt)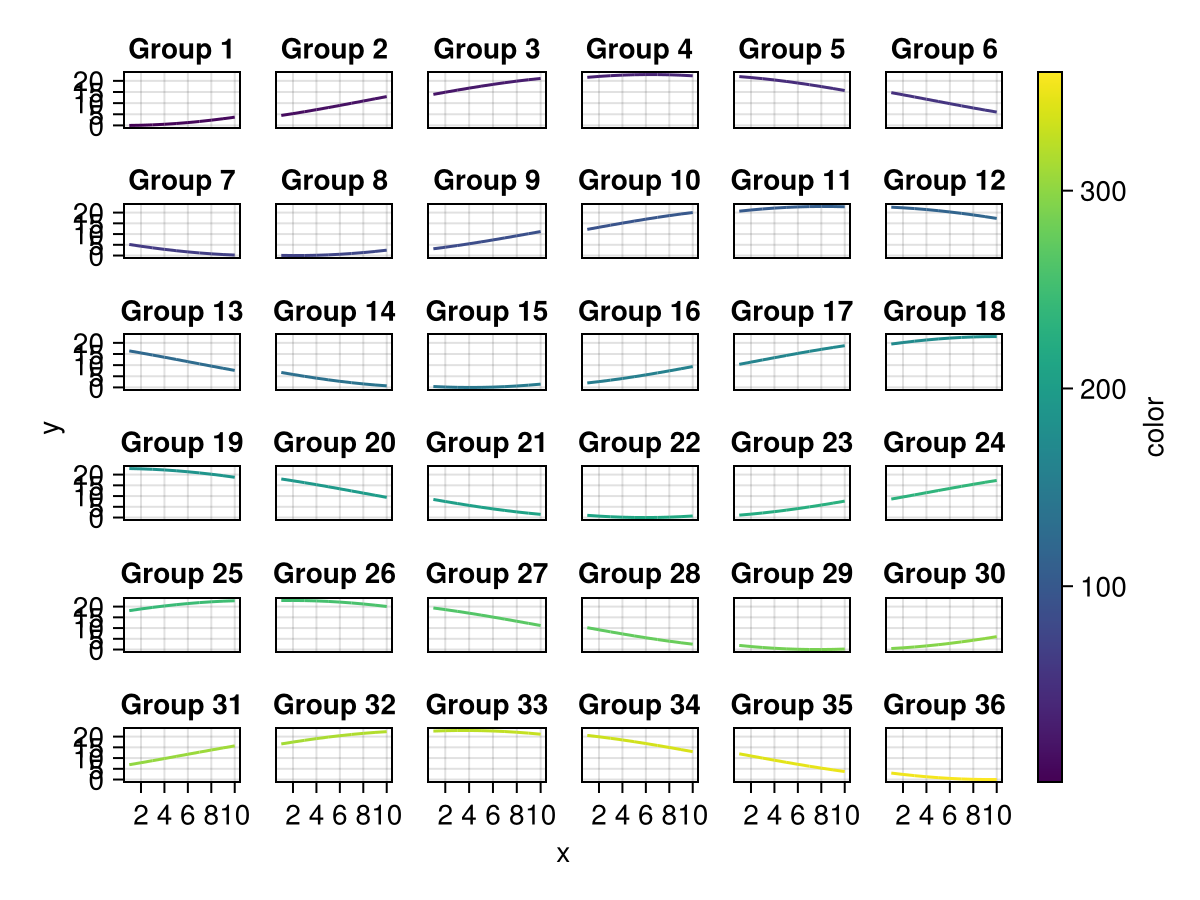
Scales are synchronized across pages. Note, however, that linked axis limits are currently not synchronized across pages. The exact synchronization behavior may be subject to change in non-breaking versions.
julia
pag = paginate(plt, layout = 9)Pagination with 4 entries (layout = 9)The object returned from draw will be a Vector{FigureGrid}.
julia
figuregrids = draw(pag)4-element Vector{AlgebraOfGraphics.FigureGrid}:
FigureGrid()
FigureGrid()
FigureGrid()
FigureGrid()You can either extract single figures from this vector...
julia
figuregrids[1]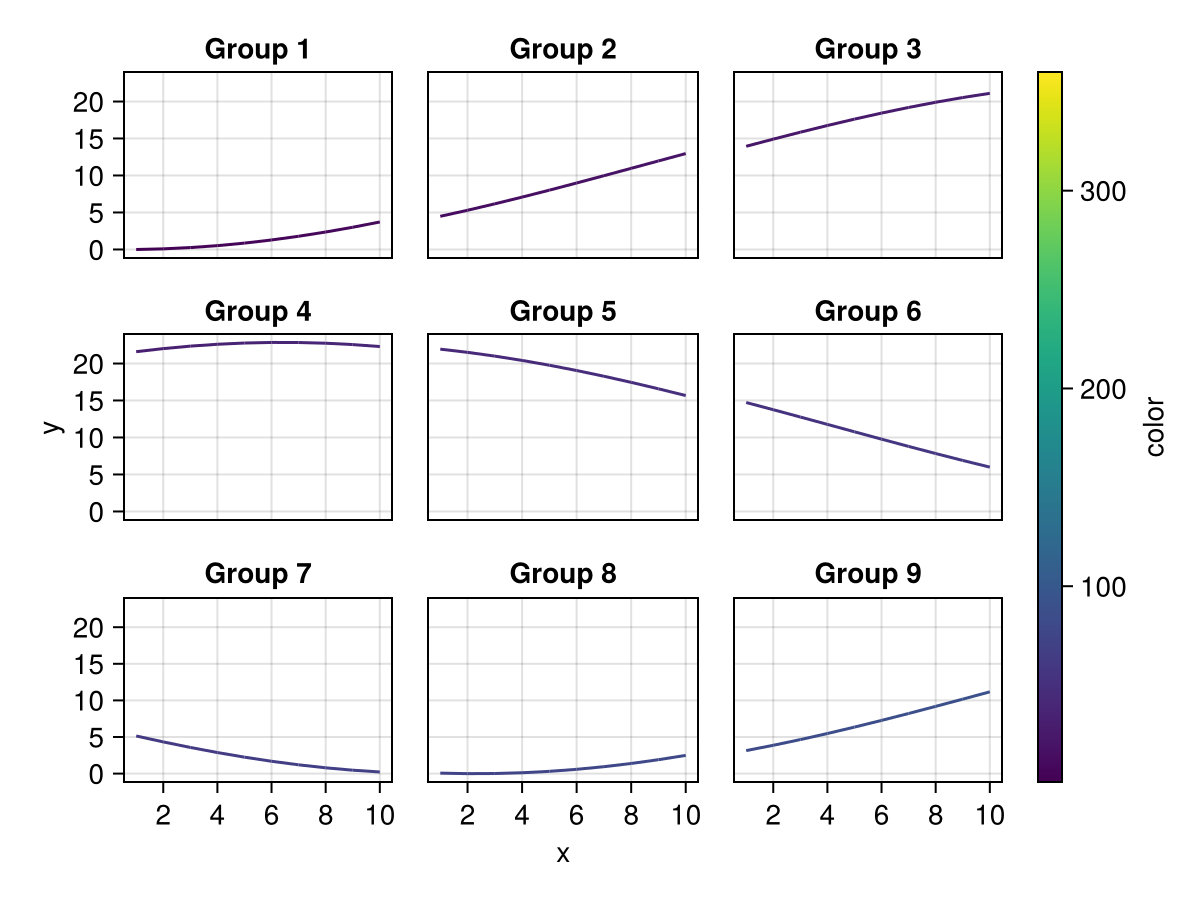
or use draw with an optional second argument specifying the index of the page to draw.
julia
draw(pag, 4)