Intro to AoG - IV - Data transformations
In the previous chapters, we have seen two different features of the mapping function, column selection and labelling:
using AlgebraOfGraphics
using CairoMakie
using DataFrames

penguins = DataFrame(AlgebraOfGraphics.penguins())

layer = data(penguins) *
    mapping(
        :bill_length_mm => "Bill length (mm)",
        :bill_depth_mm => "Bill depth (mm)",
        color = :species => "Species",
    ) *
    visual(Scatter)
draw(layer)
Row transformations
There is another feature which allows you to transform your input data before it is passed on to AoG's grouping and drawing machinery. If you pair a column selector with a Function, this function will be applied to each row of that column. For example, we can convert mm to cm in our scatter plot:
layer_cm = data(penguins) *
    mapping(
        :bill_length_mm => (x -> x / 10) => "Bill length (cm)",
        :bill_depth_mm => (x -> x / 10) => "Bill depth (cm)",
        color = :species => "Species",
    ) *
    visual(Scatter)
draw(layer_cm)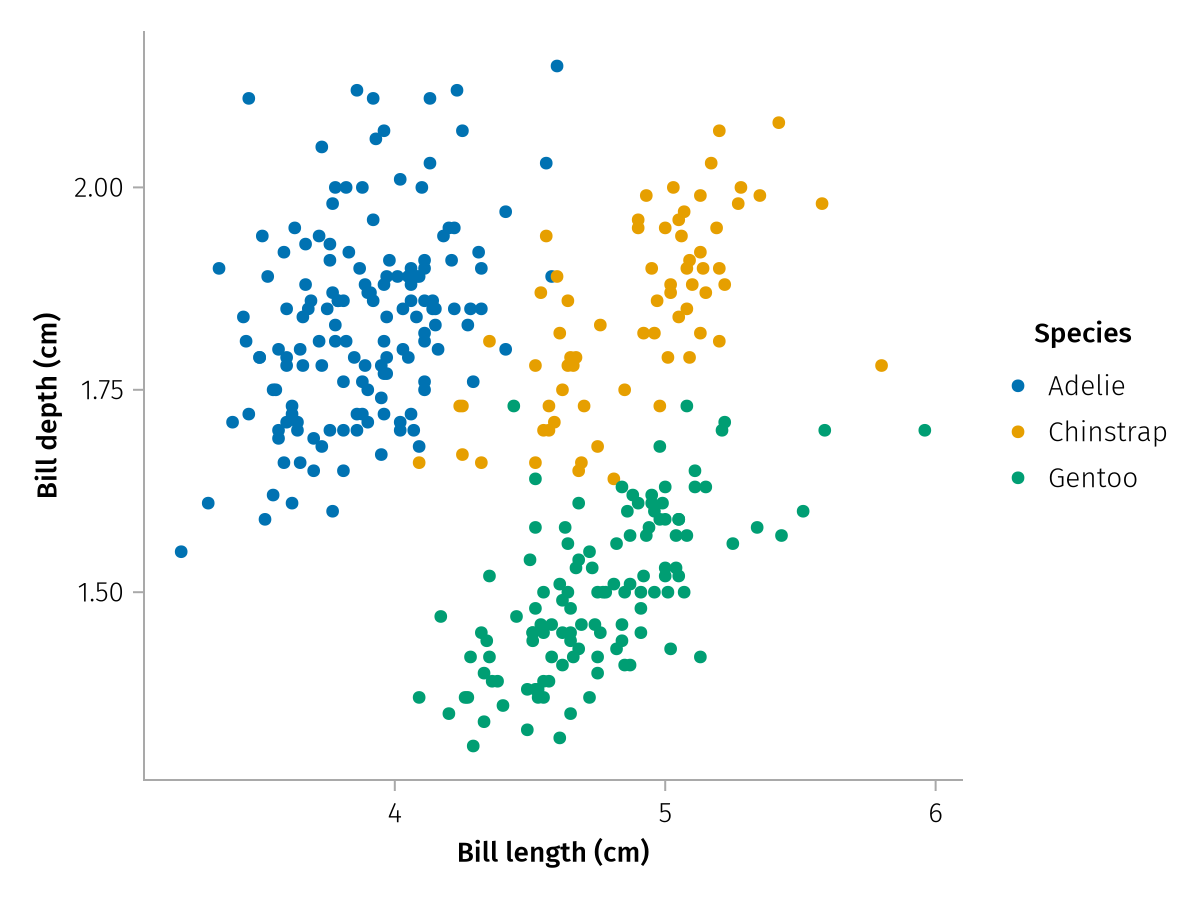
When transforming columns, the labels are unchanged by default, so take care that you correct your labels, for example when they contain units.
Note that AoG offers no mechanism to transform input data by-column instead of by-row. An example for a by-column transformation would be a z-transform, for which the column mean and standard deviation have to be computed. You have to apply such transformations to your data before plotting.
Transforming multiple rows
We can actually select two or more columns together in a mapping by wrapping them in a tuple, and we can then apply a transformation function that returns a single value. For example, we can calculate an approximation of "bill area" by multiplying bill depth and length (we have to wrap the standalone * operator in parentheses so this parses correctly):
area_spec = data(penguins) *
    mapping(
        :species,
        (:bill_length_mm, :bill_depth_mm) => (*) => "bill area",
    ) *
    visual(Violin, orientation = :horizontal)

draw(area_spec)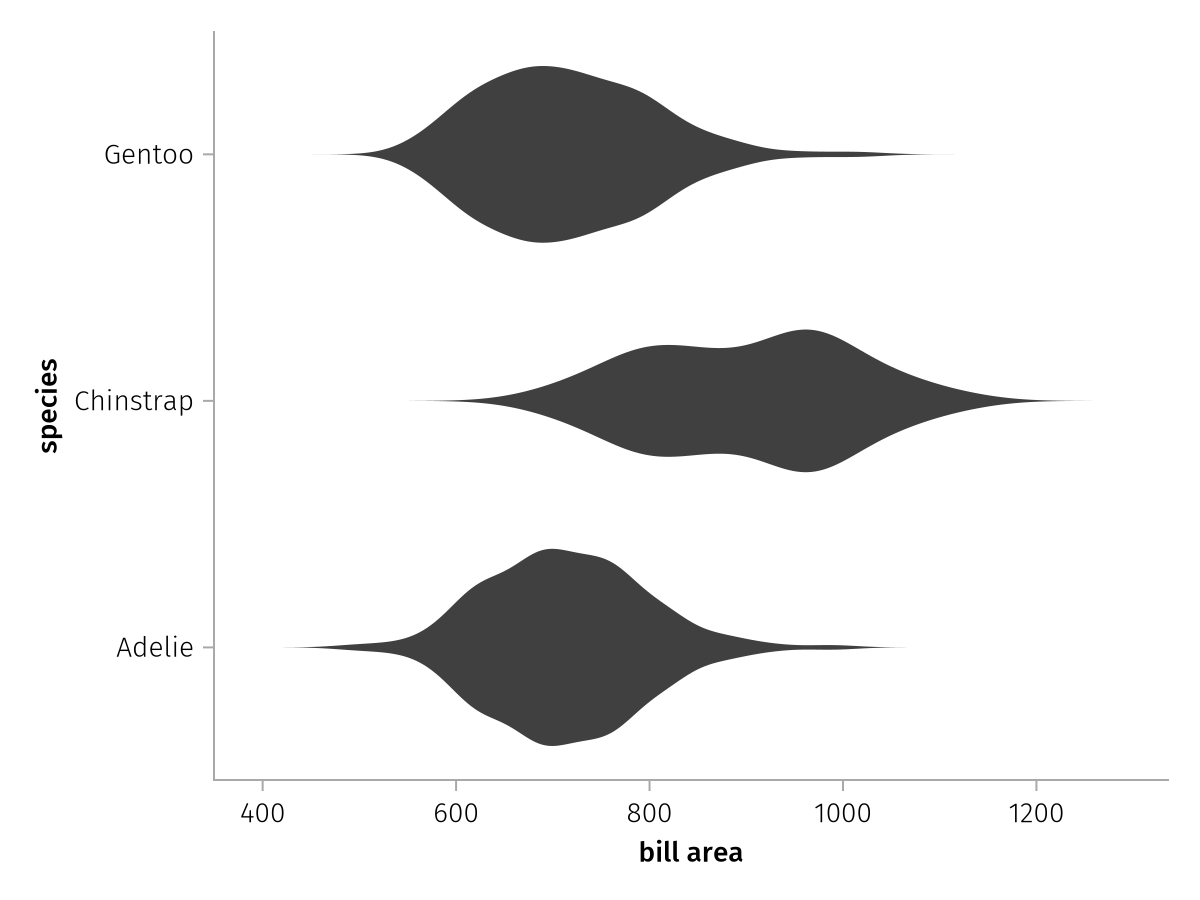
Special transformations
AoG contains a number of special functions which are intended as a way to conveniently control certain aspects of plotting, rather than numerically transforming data. The functions presented here are renamer, sorter, presorted, nonnumeric and verbatim. When used as transformation functions, all of these wrap input data in special types that cause dispatches to enable special behavior in AoGs machinery.
renamer
Calling renamer(vec) returns a function that renames every first element in vec to every last element.
layer_renamed = data(penguins) *
    mapping(
        :bill_length_mm,
        :bill_depth_mm,
        color = :species => renamer(["Adelie" => "Ad.", "Chinstrap" => "Ch.", "Gentoo" => "Ge."]),
    ) *
    visual(Scatter)
draw(layer_renamed)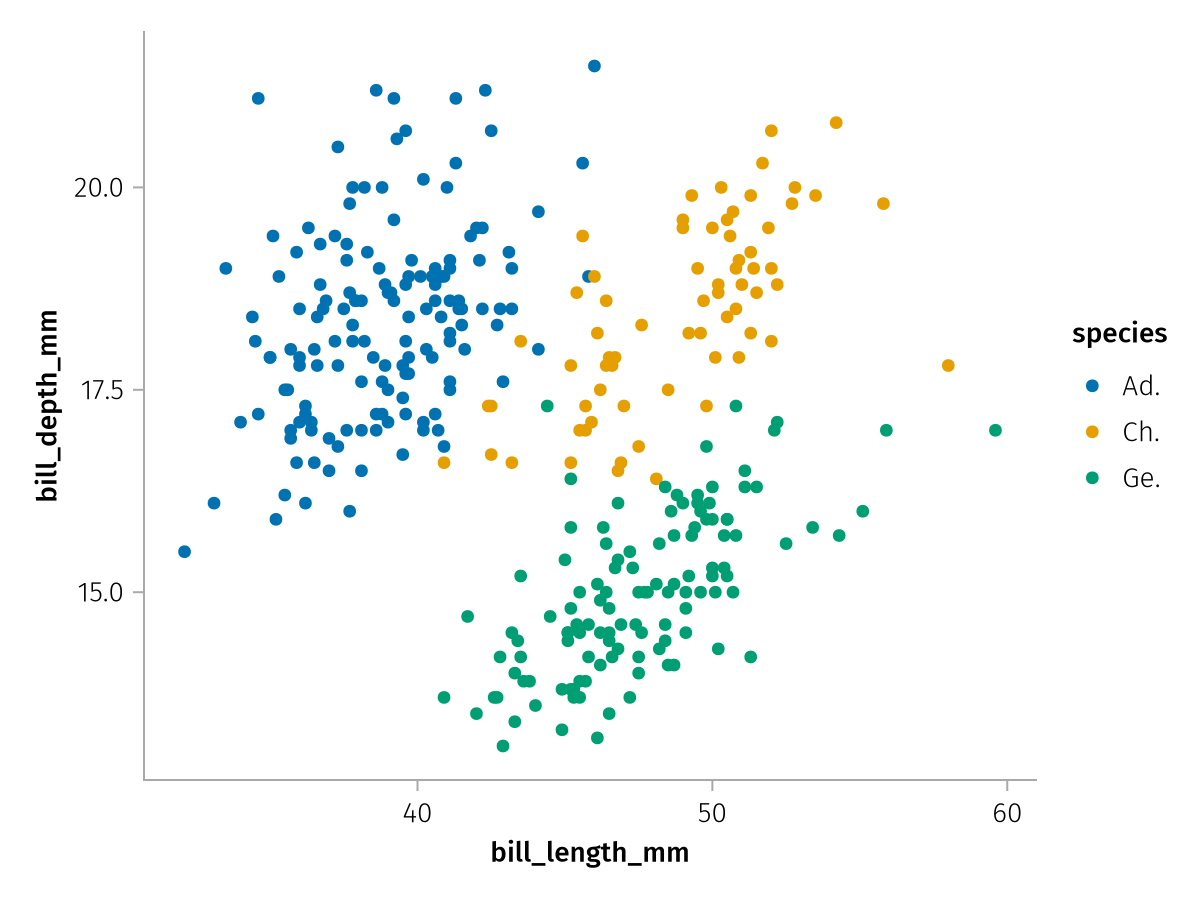
This renaming affects the order and the labelling of those groups but not the grouping itself. Note how Ad. moves to the back, and how Chinstrap and Gentoo groups do not merge although we label them both "Ch/Ge":
layer_renamed = data(penguins) *
    mapping(
        :bill_length_mm,
        :bill_depth_mm,
        color = :species => renamer(["Chinstrap" => "Ch/Ge", "Gentoo" => "Ch/Ge", "Adelie" => "Ad."]),
    ) *
    visual(Scatter)
draw(layer_renamed)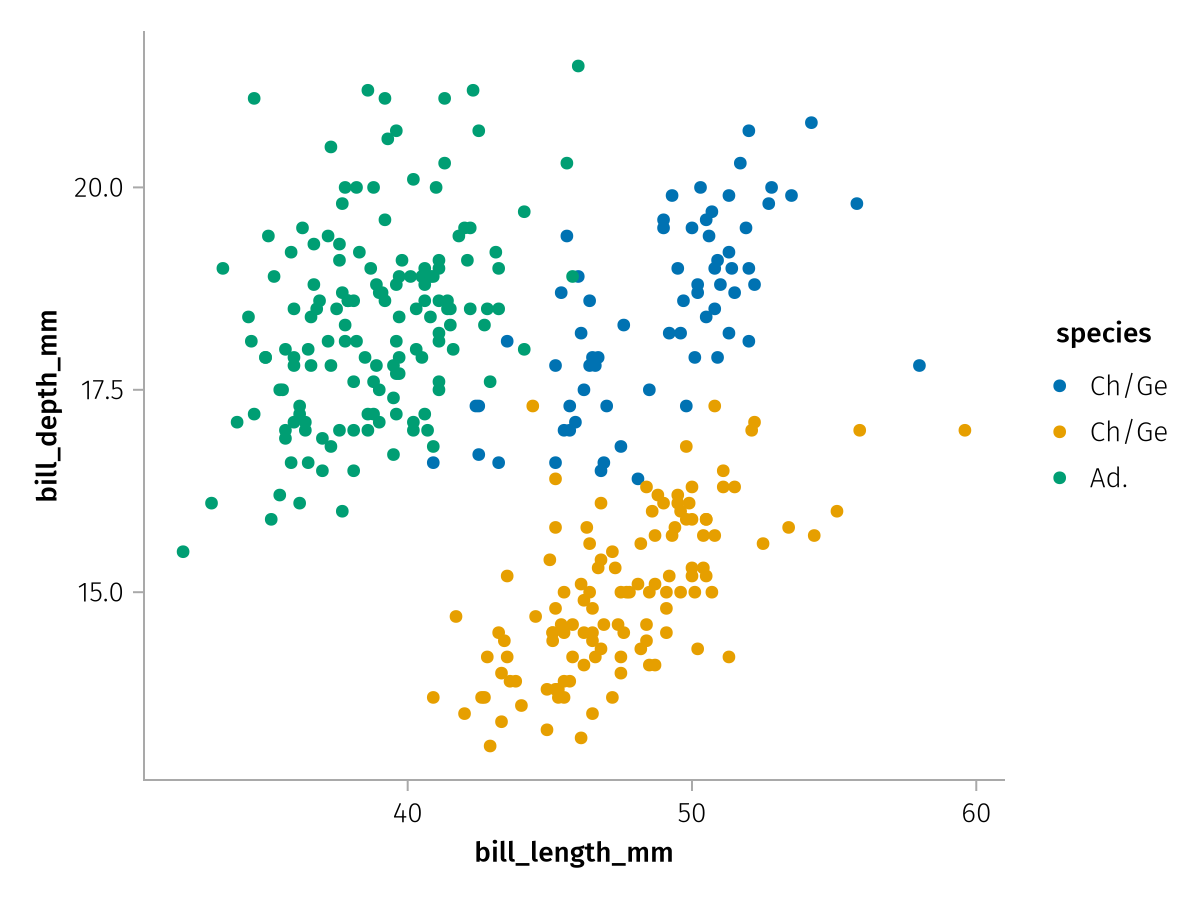
sorter
The sorter utility is similar to renamer but it only affects the order of elements and doesn't rename them:
layer_sorted = data(penguins) *
    mapping(
        :bill_length_mm,
        :bill_depth_mm,
        color = :species => sorter(["Gentoo", "Chinstrap", "Adelie"]),
    ) *
    visual(Scatter)
draw(layer_sorted)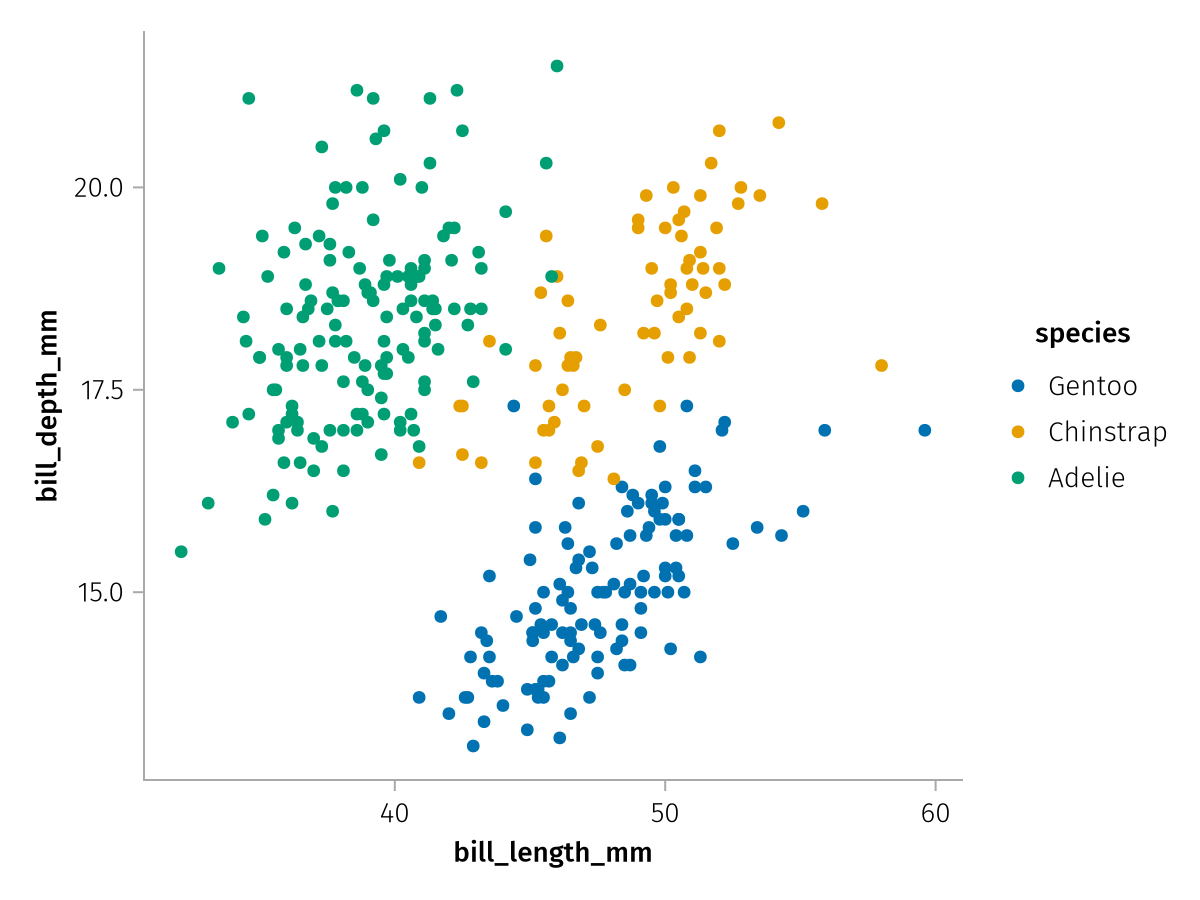
presorted
The presorted function wraps values in a way such that AlgebraOfGraphics remembers the order in which it encountered them. Normally, AoG sorts categories before plotting, but sometimes the desired order of categories is not alphanumeric but whatever the order in the source data was.
This usually applies when the source data is already sorted meaningfully, for example a list of animals that is ordered by weight. It will by default be ordered alphabetically when plotting, which destroys the weight order:
animals = DataFrame(
    Animal=["Elephant", "Hippo", "Dolphin", "Gorilla", "Cheetah", "Beaver", "Armadillo", "Flamingo"],
    Weight_kg=[4000, 1500, 200, 160, 60, 25, 6, 2.5]
)

animals_autosorted = data(animals) *
    mapping(:Animal, :Weight_kg) *
    visual(BarPlot)

draw(animals_autosorted)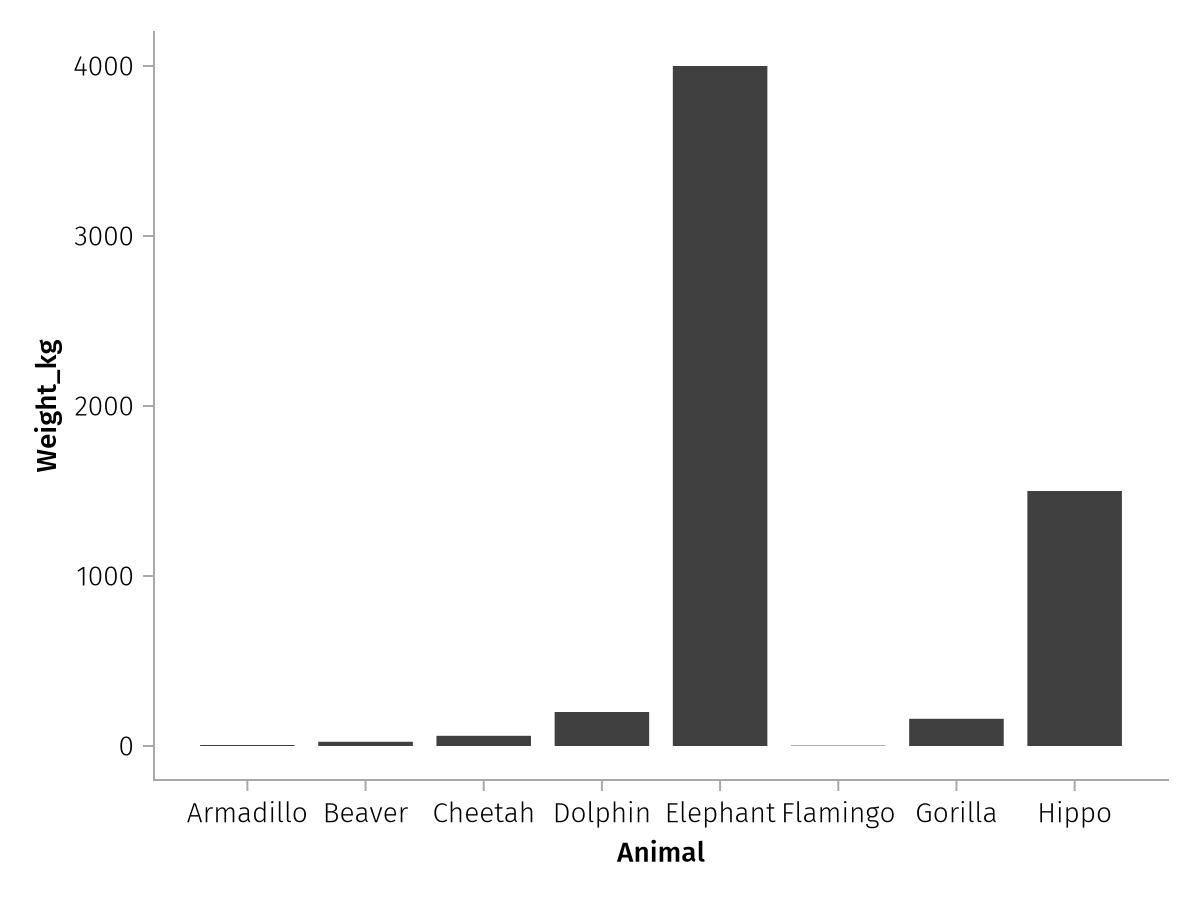
In order to leave it in its original order, we transform :Animal with presorted:
animals_presorted = data(animals) *
    mapping(:Animal => presorted, :Weight_kg) *
    visual(BarPlot)

draw(animals_presorted)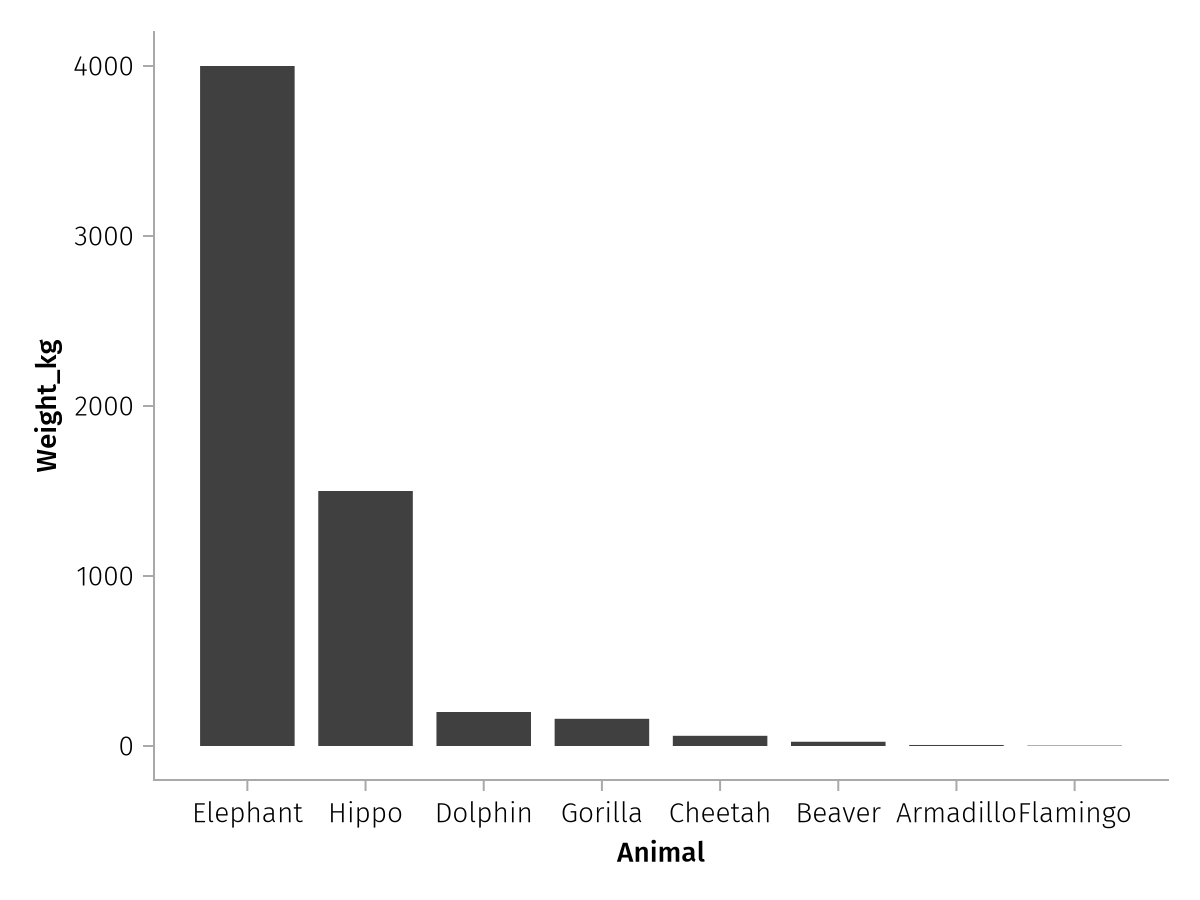
nonnumeric
As mentioned before, numeric columns are treated as continuous data by default. If we want to use such columns for grouping, we can wrap them with nonnumeric:
population = DataFrame(
    subject = repeat(1:12, inner = 30),
    time = repeat(1:30, 12),
    measurement = reduce(vcat, [cumsum(randn(30)) for _ in 1:12])
)

spec_nonnumeric = data(population) *
    mapping(
        :time,
        :measurement,
        layout = :subject => nonnumeric,
    ) *
    visual(Lines)

draw(spec_nonnumeric)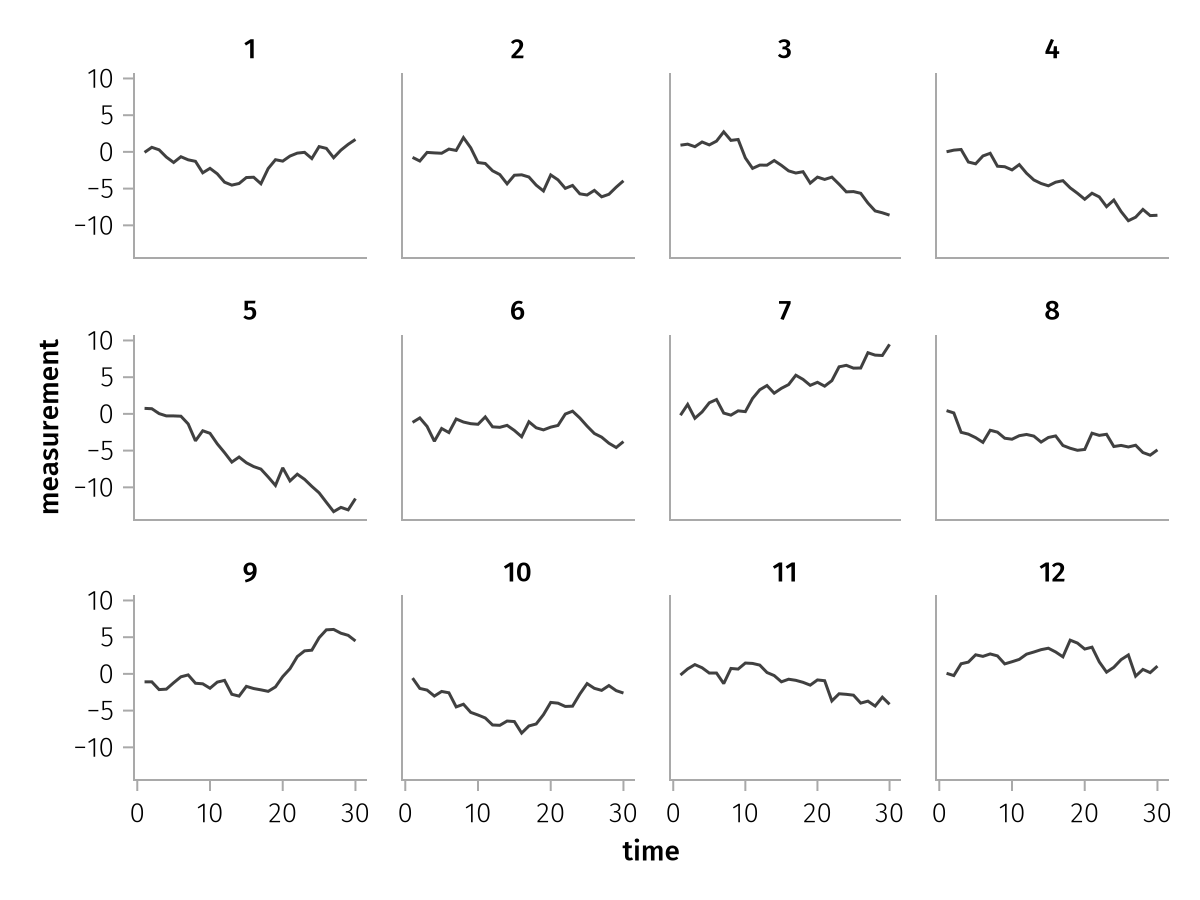
verbatim
As you already know, string columns are treated as categorical by AlgebraOfGraphics. But sometimes we may want to just pass strings as they are to Makie's plotting functions. The main situation where this happens is when we are adding Text plots because the Text plot type expects a vector of string-like objects as its text attribute.
For example, we can label a couple of our penguins with their body weight, by making a subset dataframe, and applying both a string formatting function and the verbatim function to the body_mass_g column:
smallest_largest = sort(penguins, :body_mass_g)[[1, end], :]

base_mapping = mapping(:bill_length_mm, :bill_depth_mm, color = :species)

penguin_layer = data(penguins) * base_mapping * visual(Scatter, alpha = 0.2)

text_layer = data(smallest_largest) *
    base_mapping *
    mapping(
        text = :body_mass_g => x -> verbatim("$(x)g"),
    ) *
    visual(Makie.Text, fontsize = 20)

draw(penguin_layer + text_layer)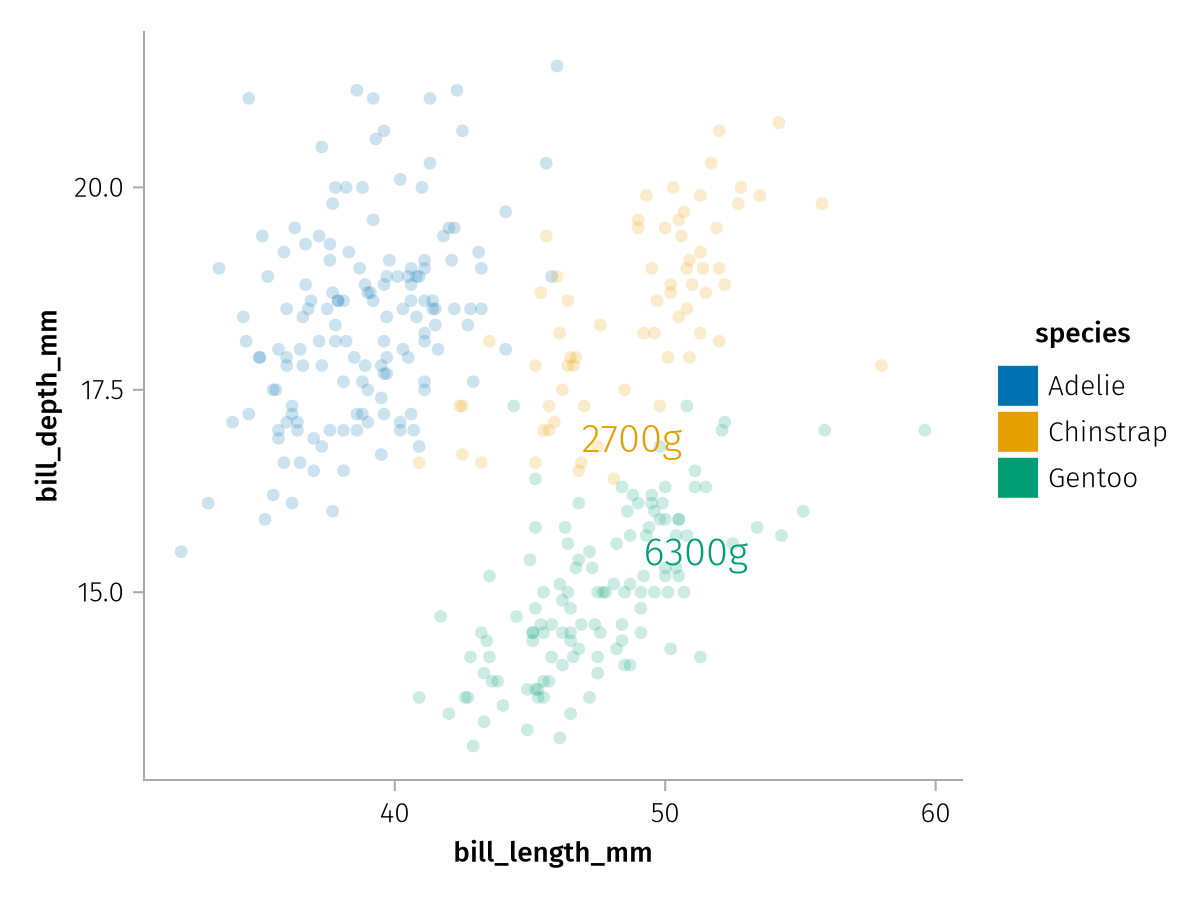
Summary
This concludes our chapter on data transformations. You have learned how to transform your data by-row on the fly, and which special transformation functions that AoG offers can make your life easier.
The next chapter will go beyond the long-format tables that we have used so far and demonstrate what other data formats AlgebraOfGraphics can handle.