Intro to AoG - III - Figure, Axis and Legend settings
In the last two chapters, we have learned how to create our first AoG visualizations, from the basic scatter plot to more advanced faceted multilayer plots. In this chapter, we are going to look at the most common options for the draw function which we can use to finalize the look of our visualization and make it more suitable for publication.
Let's use this version of our familiar penguin plot for modification:
using AlgebraOfGraphics
using CairoMakie
using DataFrames

penguins = DataFrame(AlgebraOfGraphics.penguins())

spec = data(penguins) *
    mapping(
        :bill_length_mm,
        :bill_depth_mm,
        row = :sex,
        col = :island,
        color = :species
    ) *
    visual(Scatter)

draw(spec)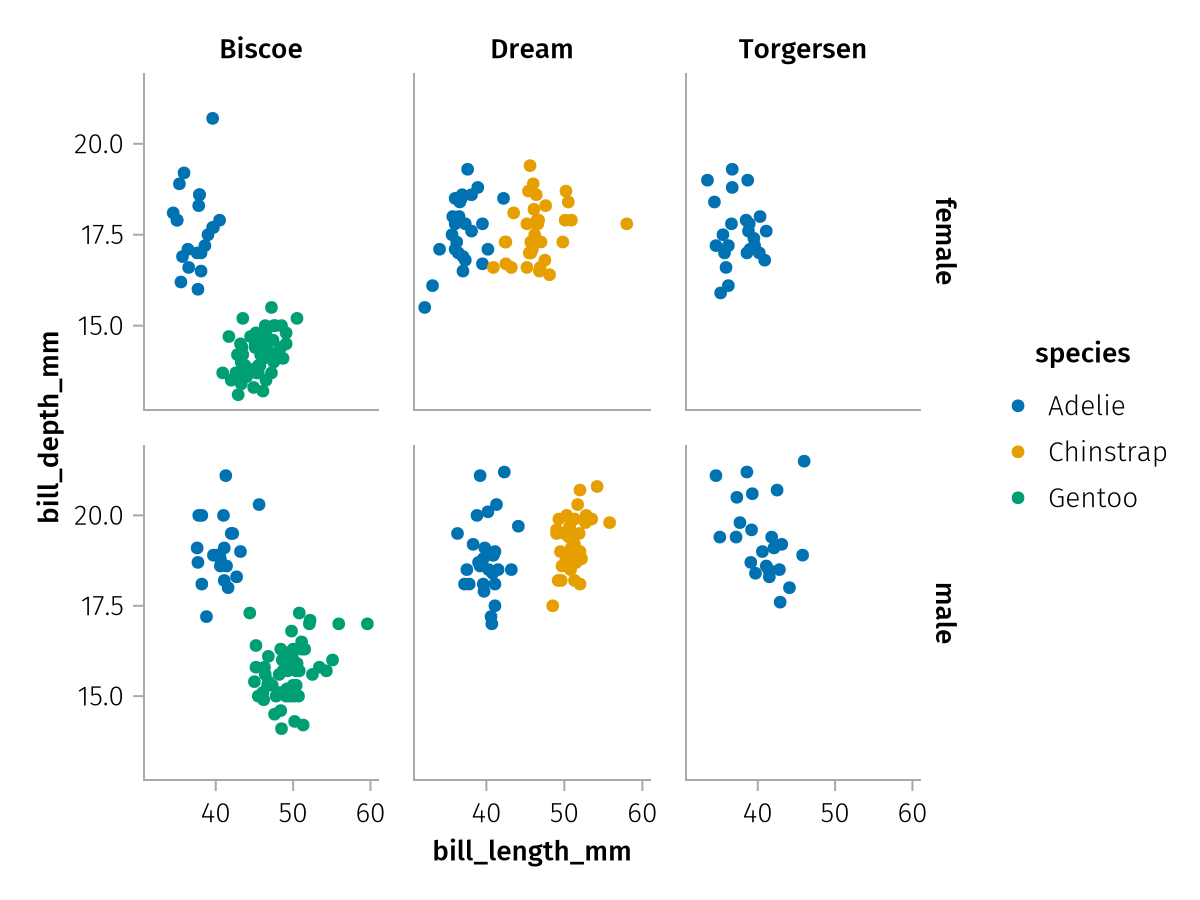
Figure settings
Size and backgroundcolor
The figure keyword to draw can be used to set some special keywords that AoG implements, while the rest is forwarded to Makie's Figure constructor. It can therefore be used to set the size of the figure as well as the backgroundcolor. If you need to match a specific figure and font size for publication, you can learn how to do that over at this How-To page in the Makie docs.
figure_options = (;
    size = (500, 300),
    backgroundcolor = :gray90,
)
draw(spec; figure = figure_options)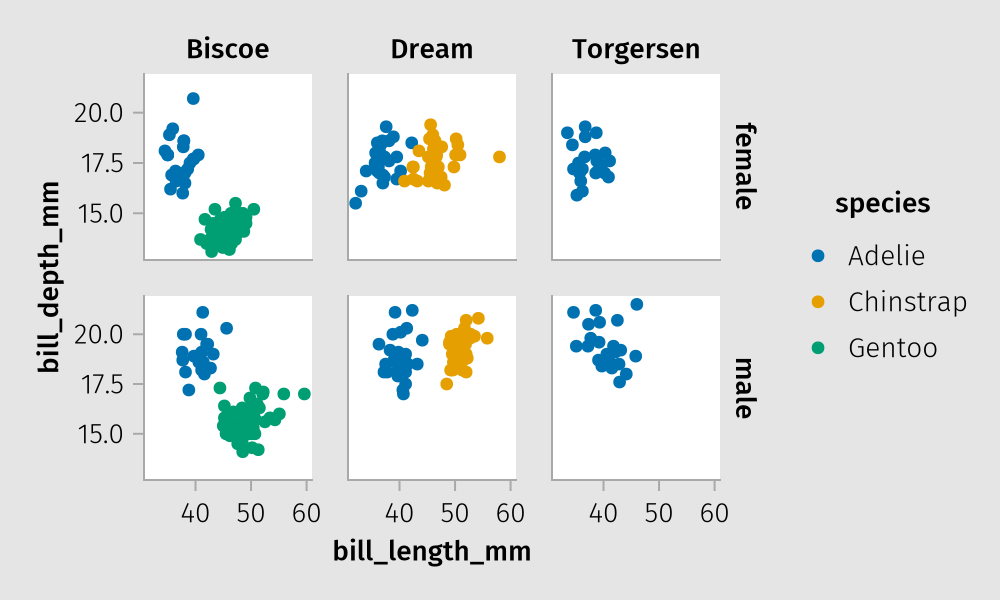
Titles and subtitles
AlgebraOfGraphics implements some convenience for adding titles and subtitles to a figure.
figure_options = (;
    title = "Palmer Penguins",
    subtitle = """
        Ecological Sexual Dimorphism and Environmental Variability
        within a Community of Antarctic Penguins""",
)
draw(spec; figure = figure_options)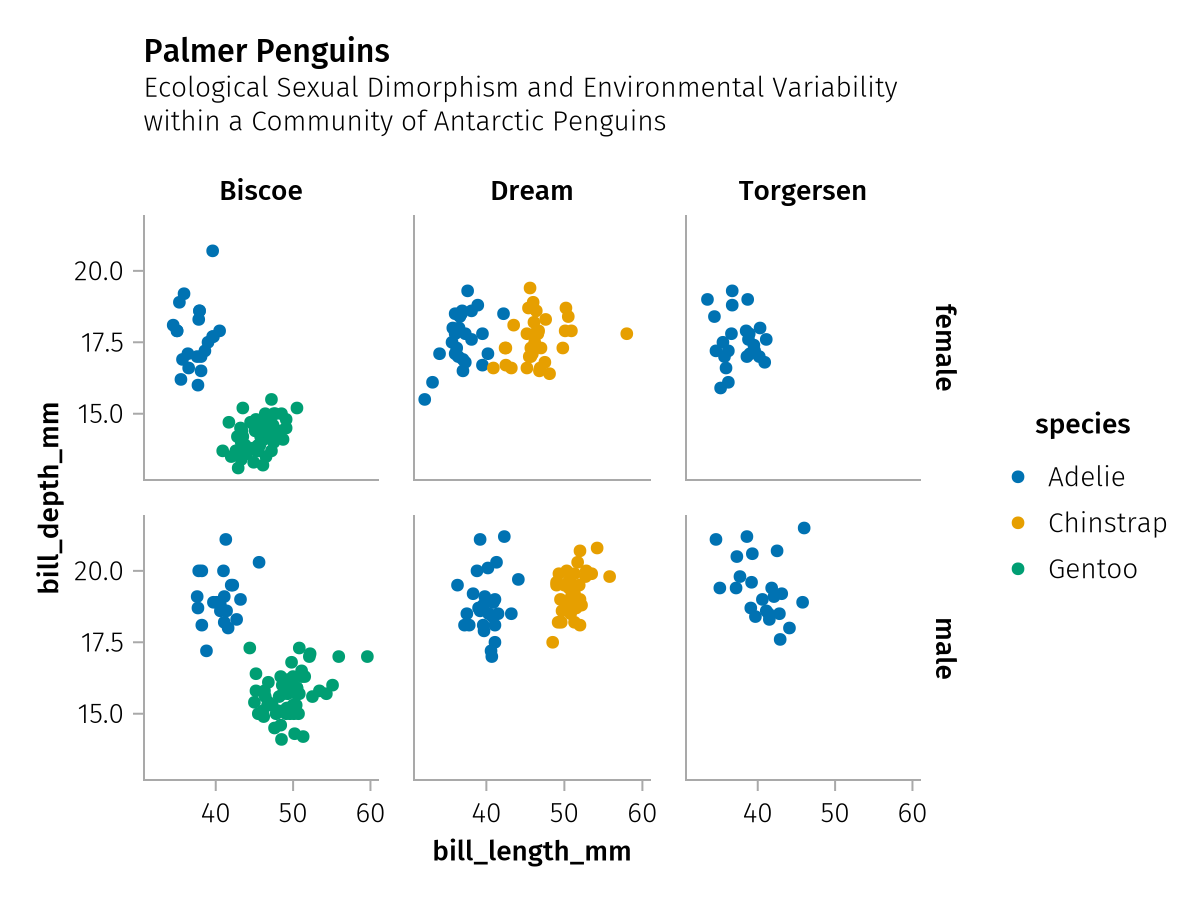
Alignment of the titles can be set via titlealign:
figure_options = (;
    title = "Palmer Penguins",
    subtitle = """
        Ecological Sexual Dimorphism and Environmental Variability
        within a Community of Antarctic Penguins""",
    titlealign = :right,
)
draw(spec; figure = figure_options)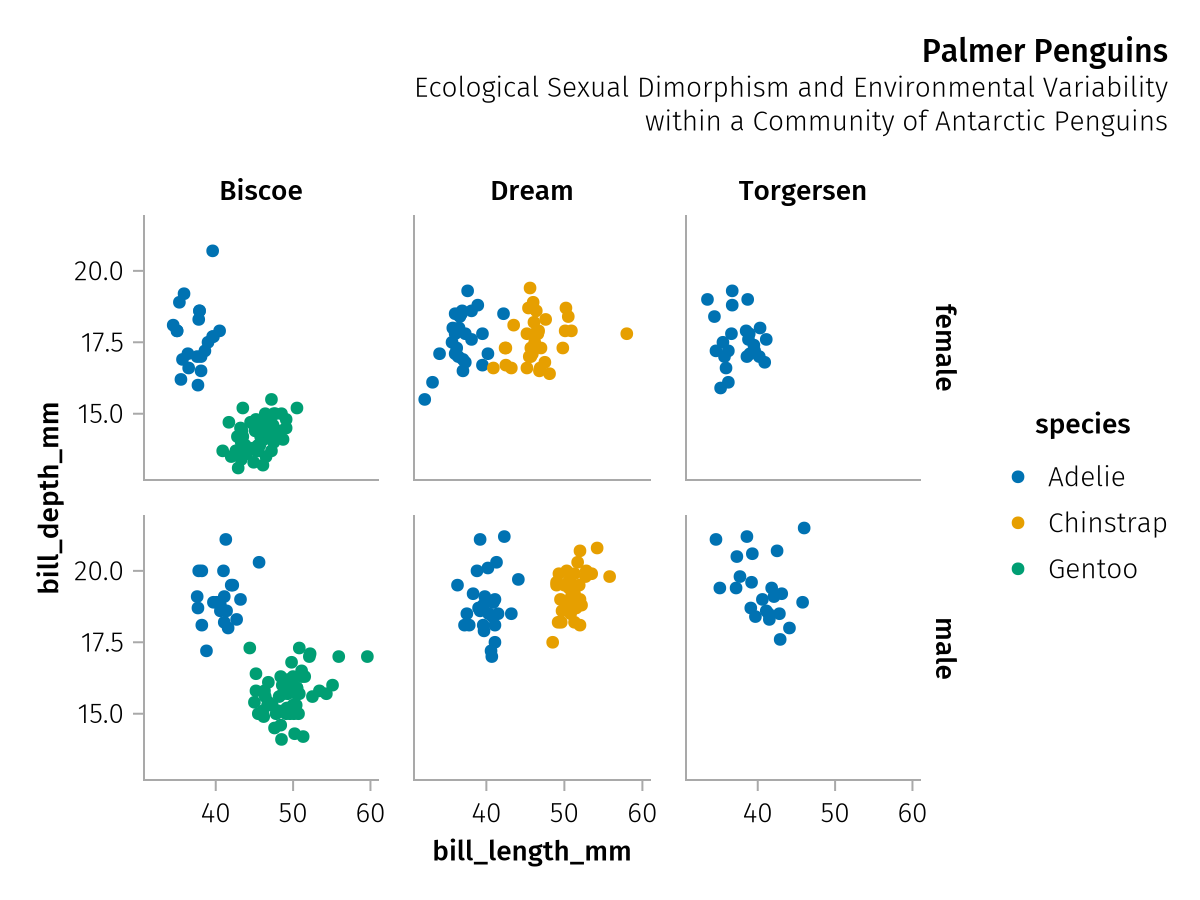
Footnotes
AlgebraOfGraphics also adds a convenience feature for footnotes. These are simply given as a vector of objects compatible with Makie's text function.
figure_options = (;
    footnotes = [
        "No penguins were harmed during the production of this figure.",
    ]
)
draw(spec; figure = figure_options)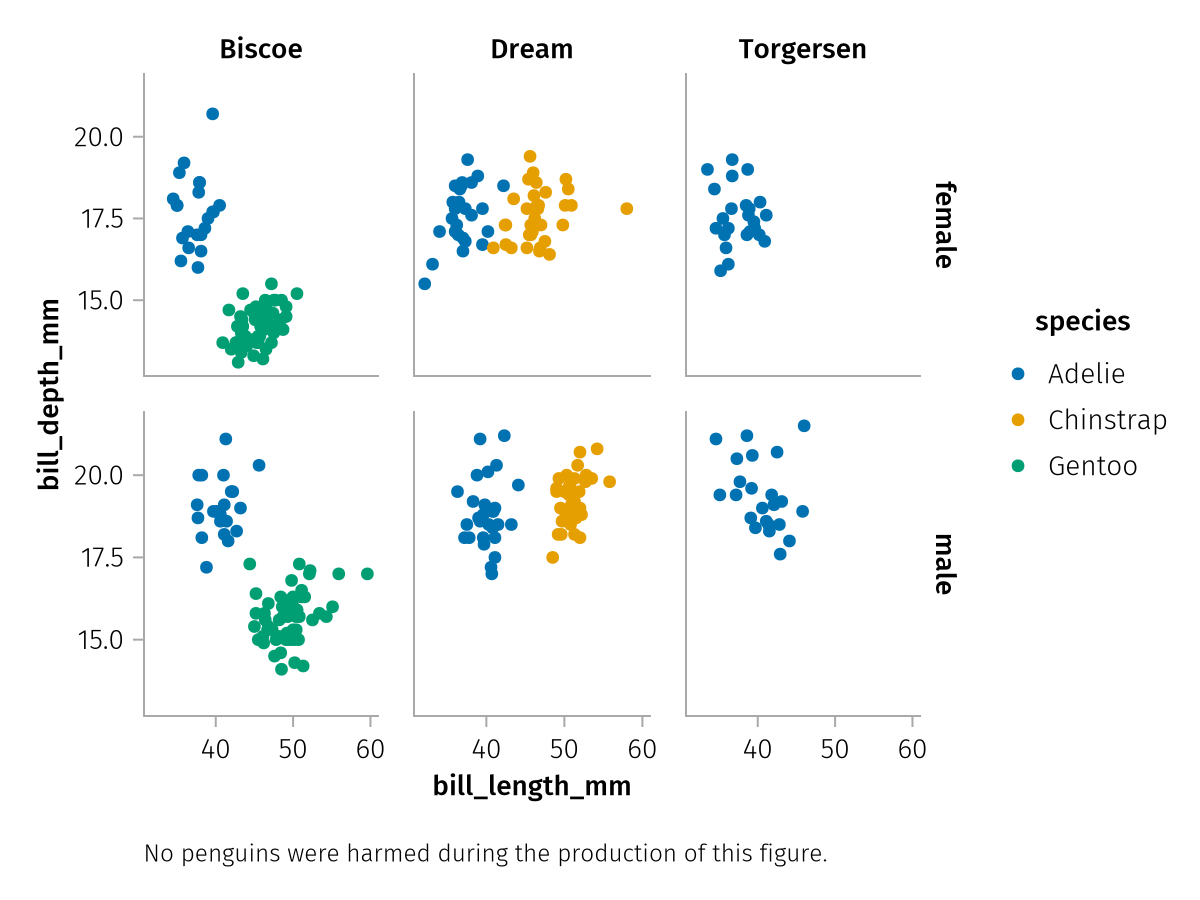
Axis settings
Makie's Axis object has many attributes that can change its visual appearance, all of them are listed here in Makie's documentation. You can use the axis keyword to forward attributes to all axes in an AoG plot. Keep in mind that some attributes are supposed to be controlled by AoG itself, for example setting the correct date ticks for a DateTime plot. So you should restrict your choice of axis keywords to those that don't interfere with the way AoG sets up the plot.
Limits
To zoom in or out, you can specify manual limits using the limits keyword. You can pass either (xmin, xmax, ymin, ymax) where any element can be nothing to leave it automatic, or (x_min_and_max, y_min_and_max) where each element can either be a 2-tuple or nothing to leave that dimension automatic:
draw(spec; axis = (; limits = (nothing, (10, 30))))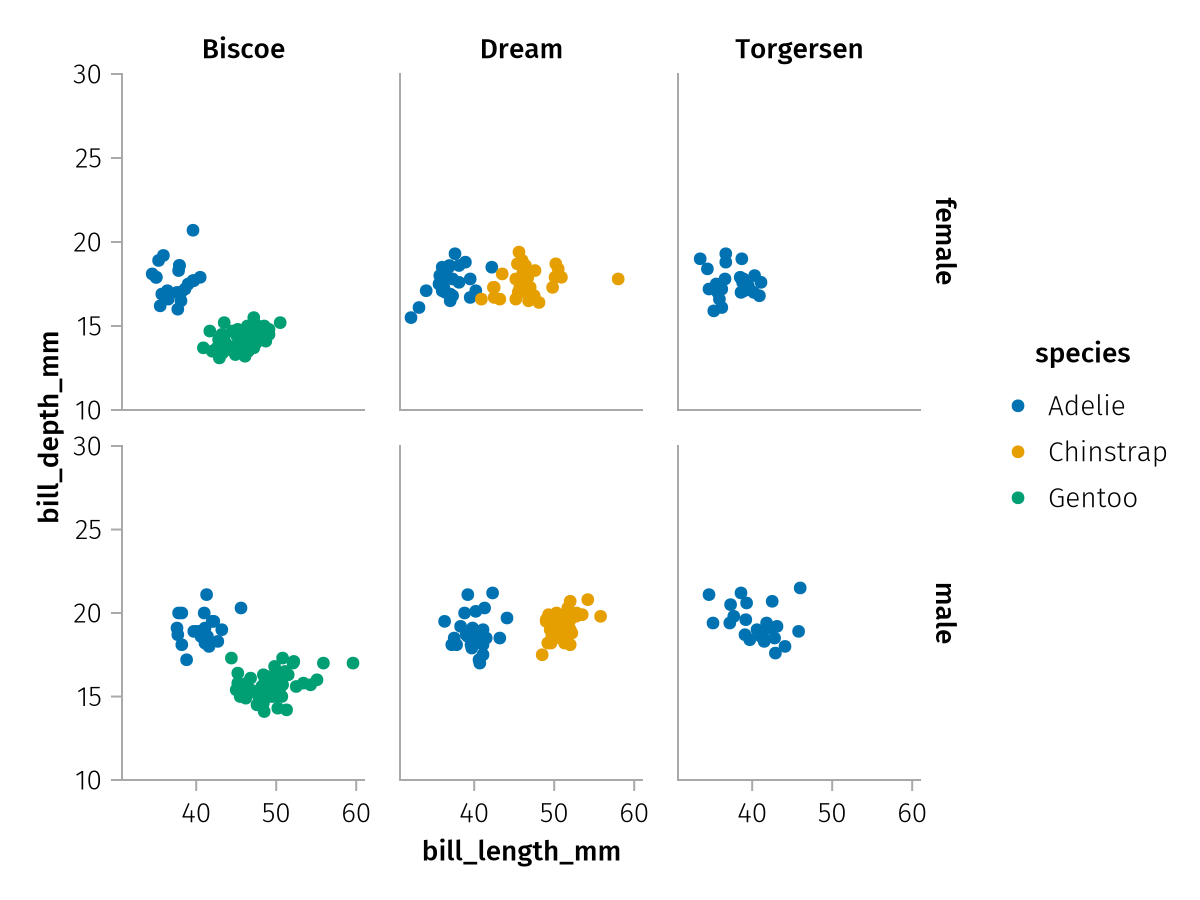
Axis scales
You can switch axes to any scale function that Makie supports. The most common example is the log10 function:
draw(spec; axis = (; xscale = log10, yscale = log10))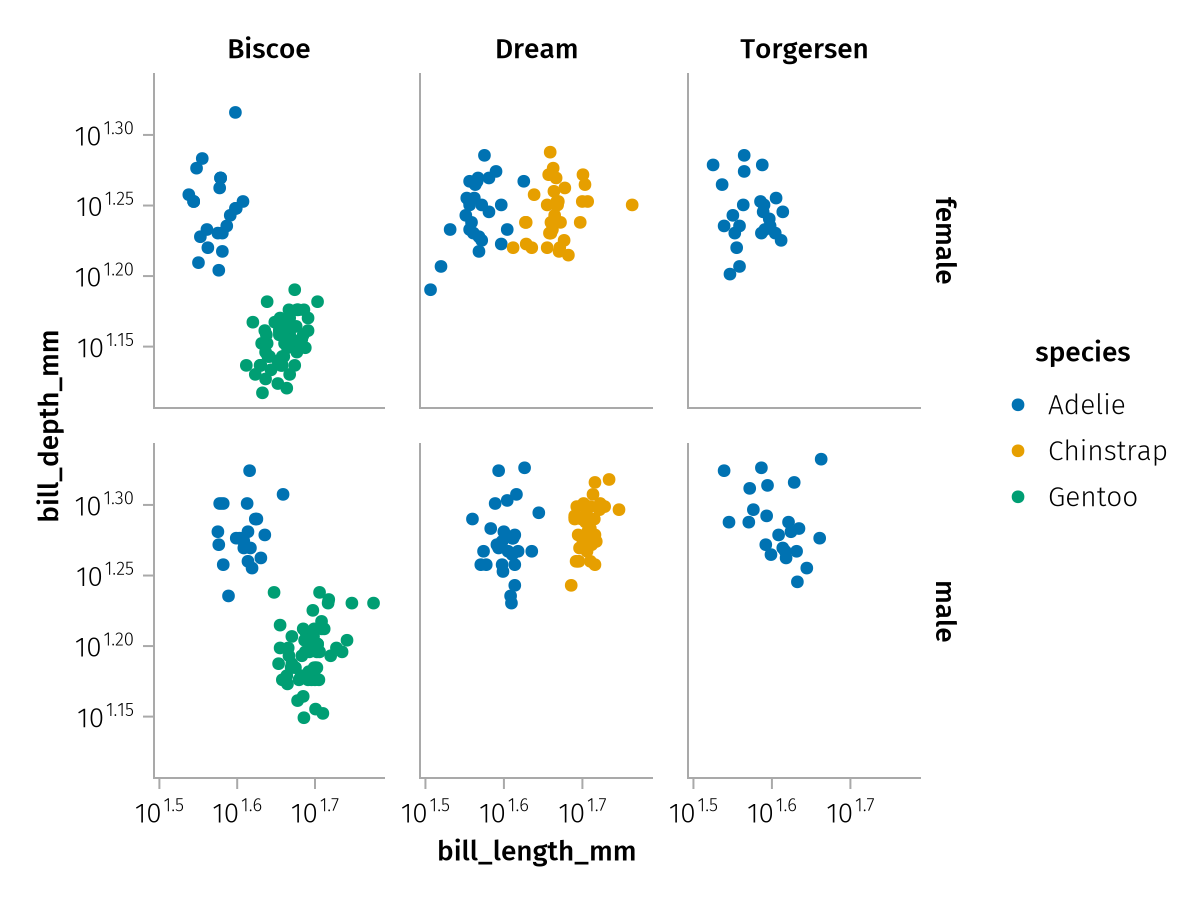
Ticks
Sometimes you may not be satisfied with automatically chosen ticks, in this case you can override them. The simplest way is to pass a vector of tick locations:
draw(spec; axis = (; xticks = 35:5:60))
Or a combination of tick locations and tick labels:
draw(spec; axis = (; xticks = ([35, 45, 55], ["35\n(XS)", "45\n(M)", "55\n(XL)"])))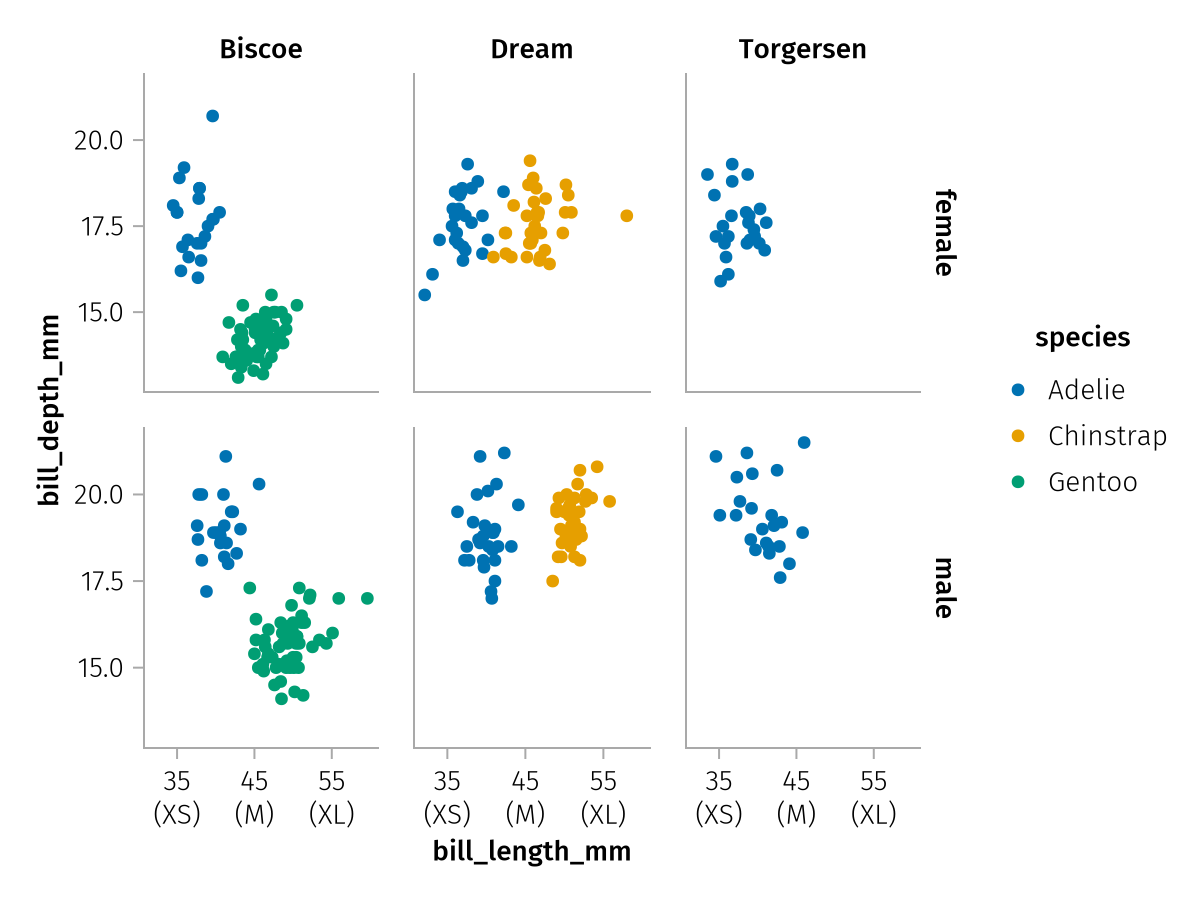
If you are satisfied with the automatic tick locations but not their formatting, you can also just change that. Makie has many options to specify tick formats, one of them is the format string:
draw(spec; axis = (; ylabel = "Bill depth", ytickformat = "{:.1f} mm"))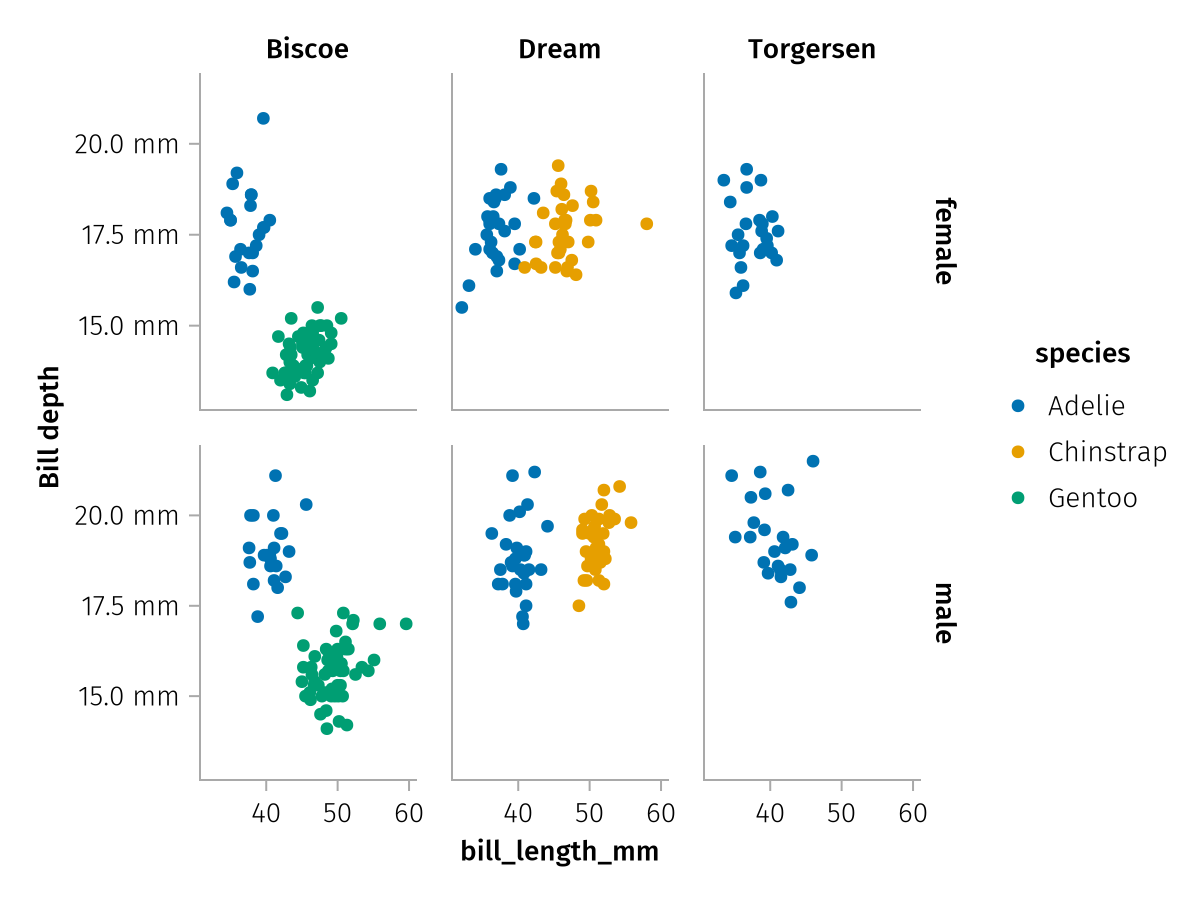
Ticklabel rotation
Another common modification is adding ticklabel rotation to make more space for long labels:
violins = data(penguins) * mapping(:species, :bill_length_mm, col = :island) * visual(Violin)

draw(violins; axis = (; xticklabelrotation = pi/4))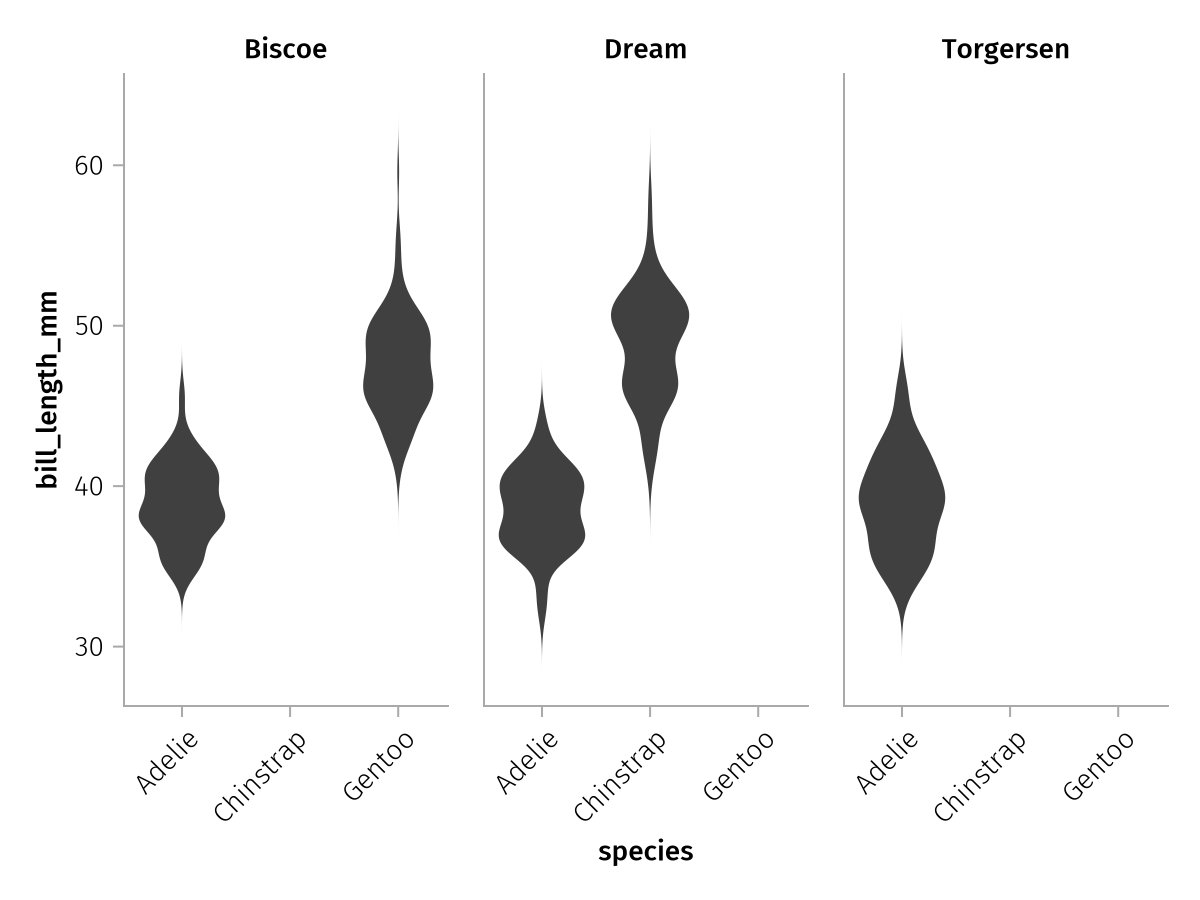
Axis size
Sometimes we don't want our axis sizes to follow the space available in our figure, but we want to size the figure such that our axes can all have a specific size. For example, quadratic axes are often desired. AlgebraOfGraphics makes this easy by using Makie's resize_to_layout function automatically in the background when draw is called, meaning that if axis sizes are set, the figure will automatically resize to contain them:
draw(spec; axis = (; width = 120, height = 120))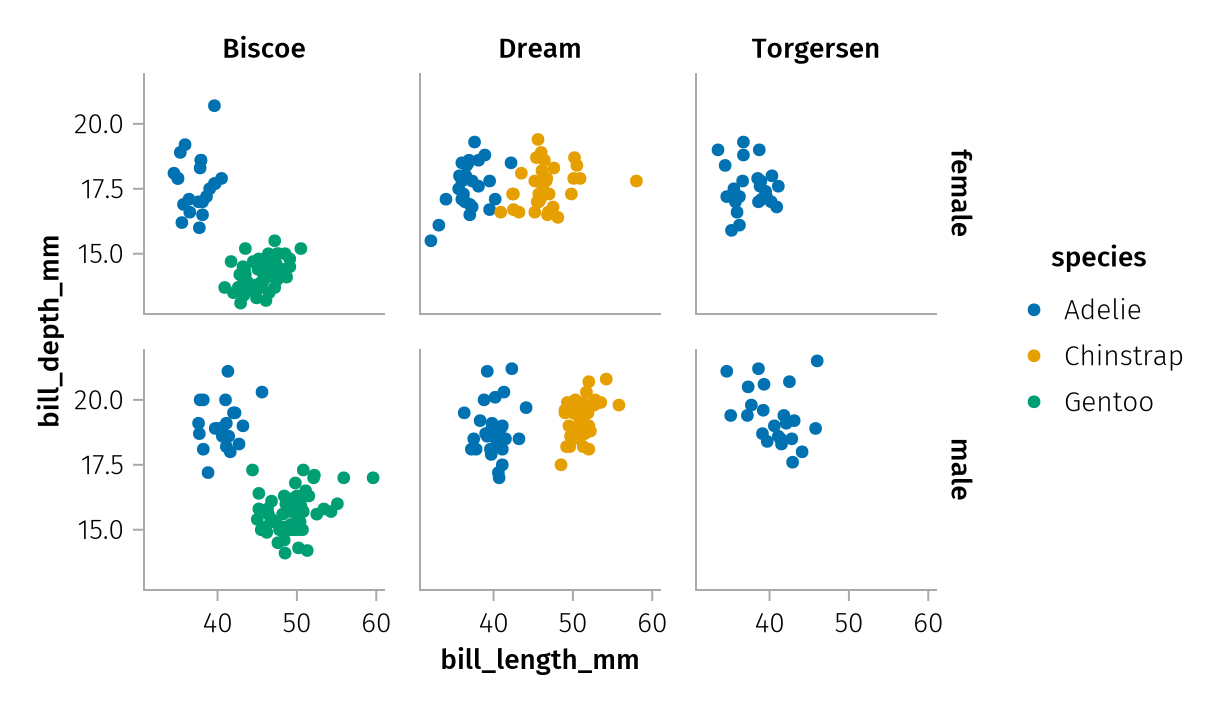
Titles and subtitles
Instead of setting axis title and subtitle via the axis options, it is recommended to use the figure options instead, so you can freely switch between faceted and non-faceted plots. Axis title and subtitle do not work with facet plots because they are repeated for every facet and conflict with the column labels:
draw(spec; axis = (; title = "Not good"))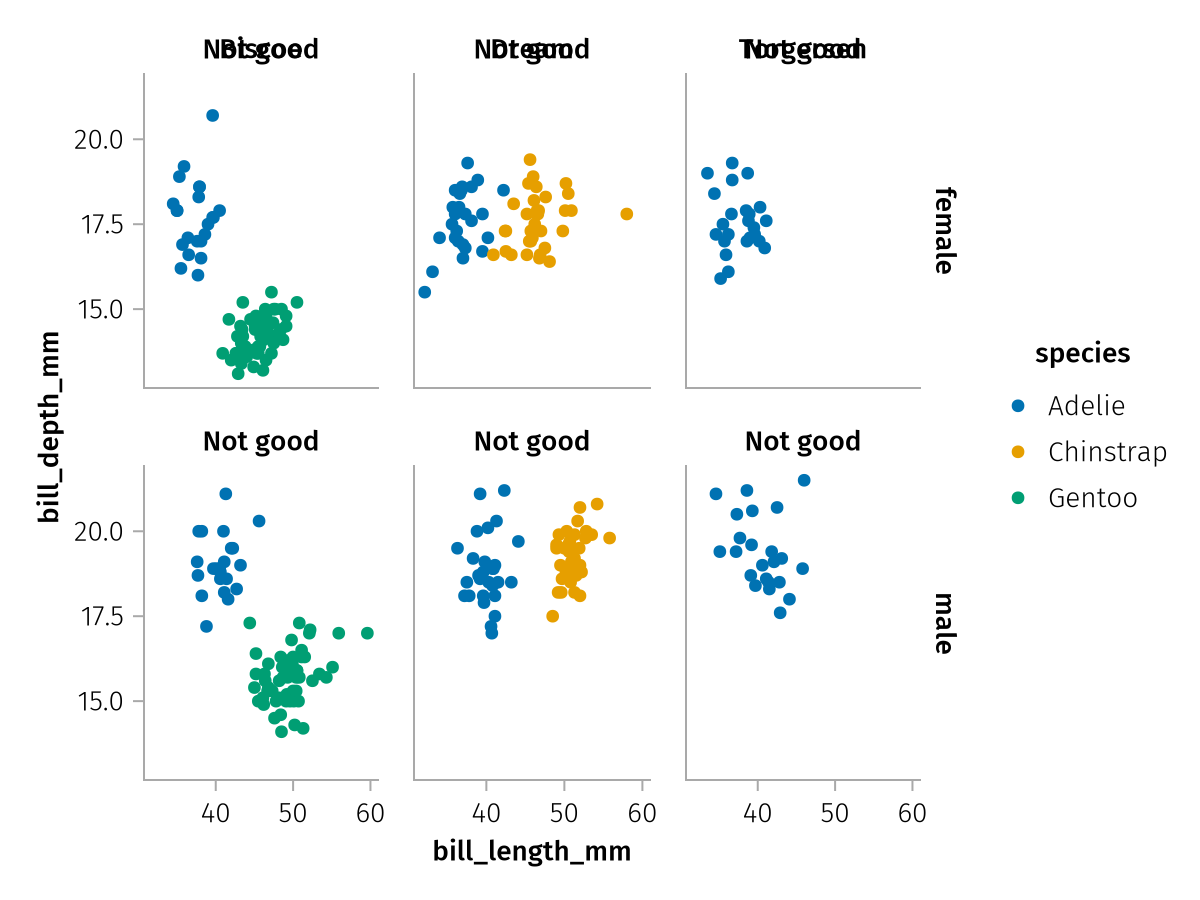
For simple single-axis plots, however, the axis options work as expected:
simple_spec = data(penguins) *
    mapping(:bill_length_mm, :bill_depth_mm, color = :species) *
    visual(Scatter)

axis_options = (;
    title = "Palmer Penguins",
    subtitle = """
        Ecological Sexual Dimorphism and Environmental Variability
        within a Community of Antarctic Penguins""",
)

draw(simple_spec; axis = axis_options)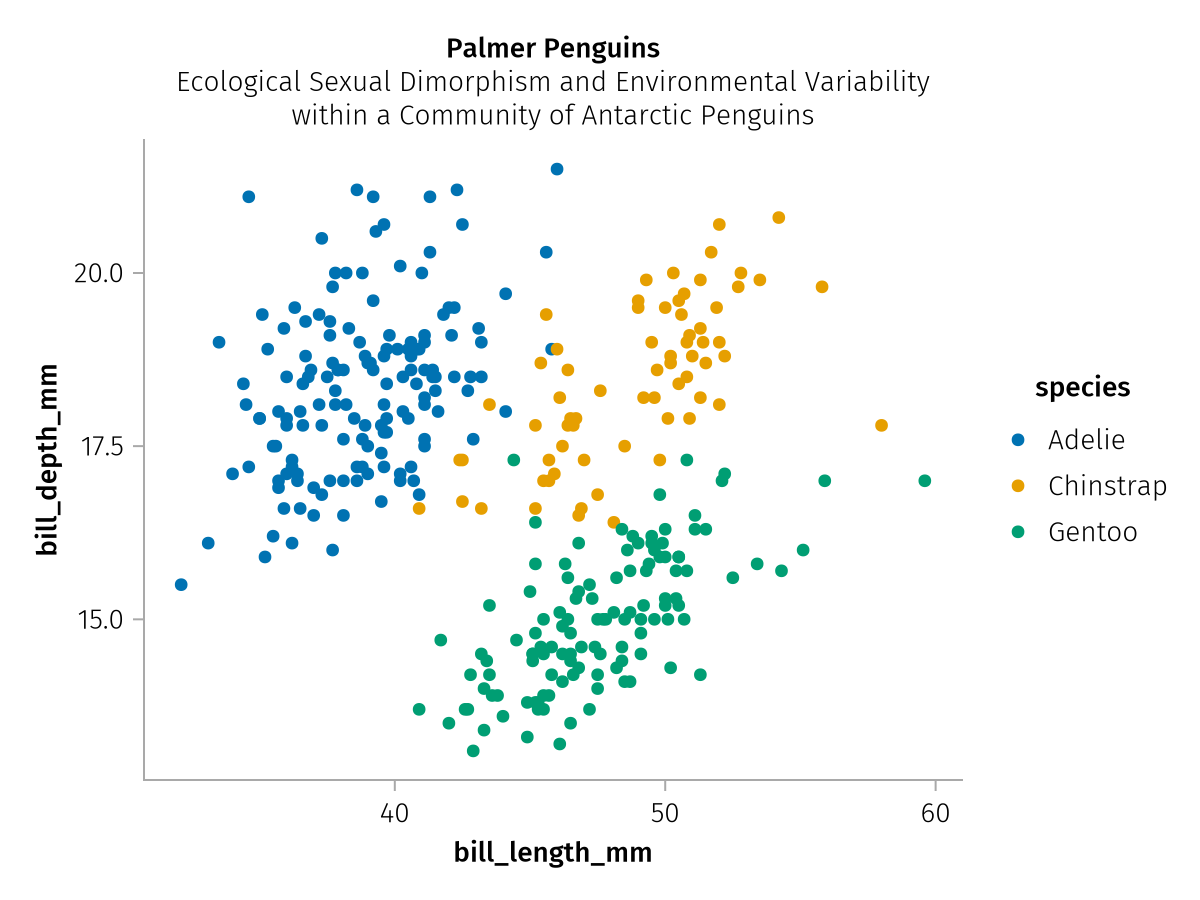
Legend settings
Position
AlgebraOfGraphics adds the position keyword on top of the usual set of Makie attributes for Legend which controls the placement of the legend.
draw(spec; legend = (; position = :left))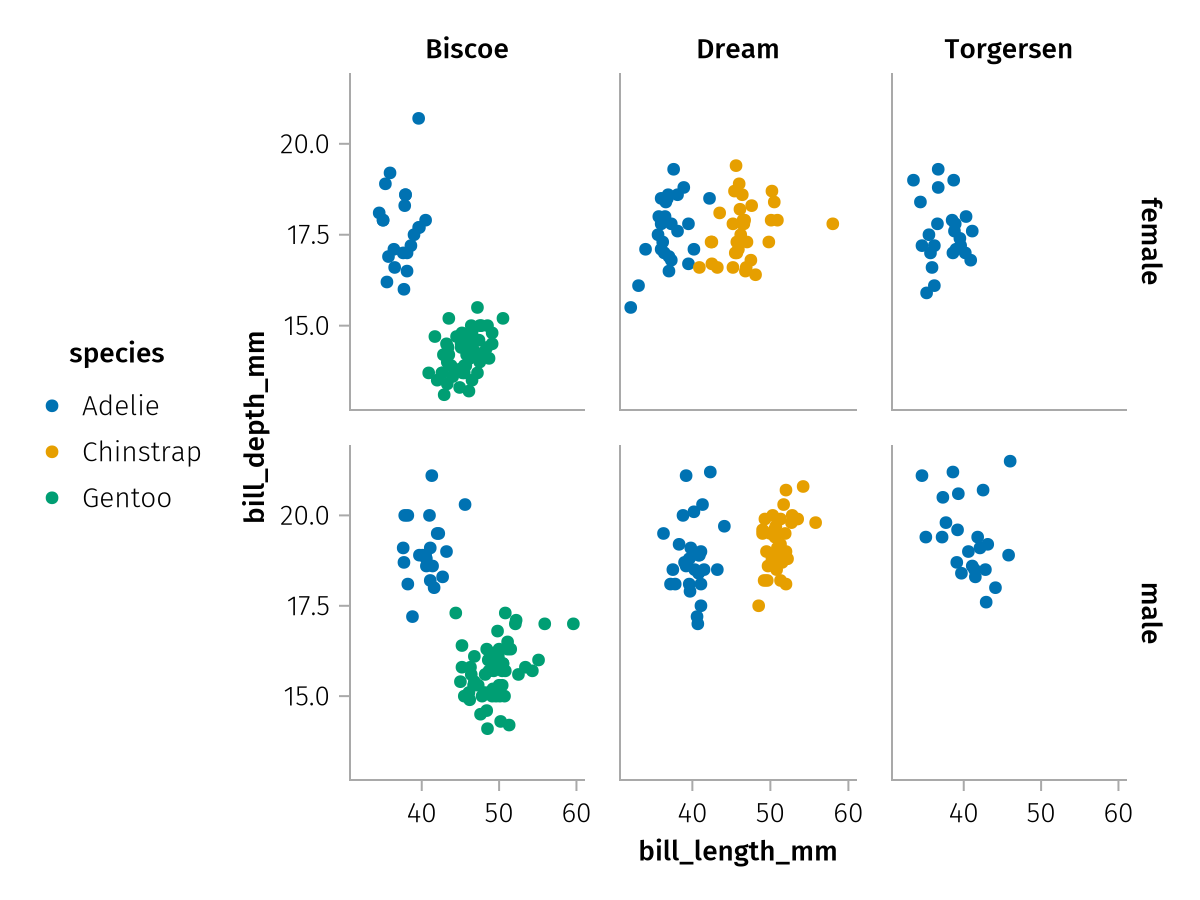
Note that placing the legend at the :bottom or the :top automatically switches to a horizontal legend.
draw(spec; legend = (; position = :bottom))
draw(spec; legend = (; position = :top))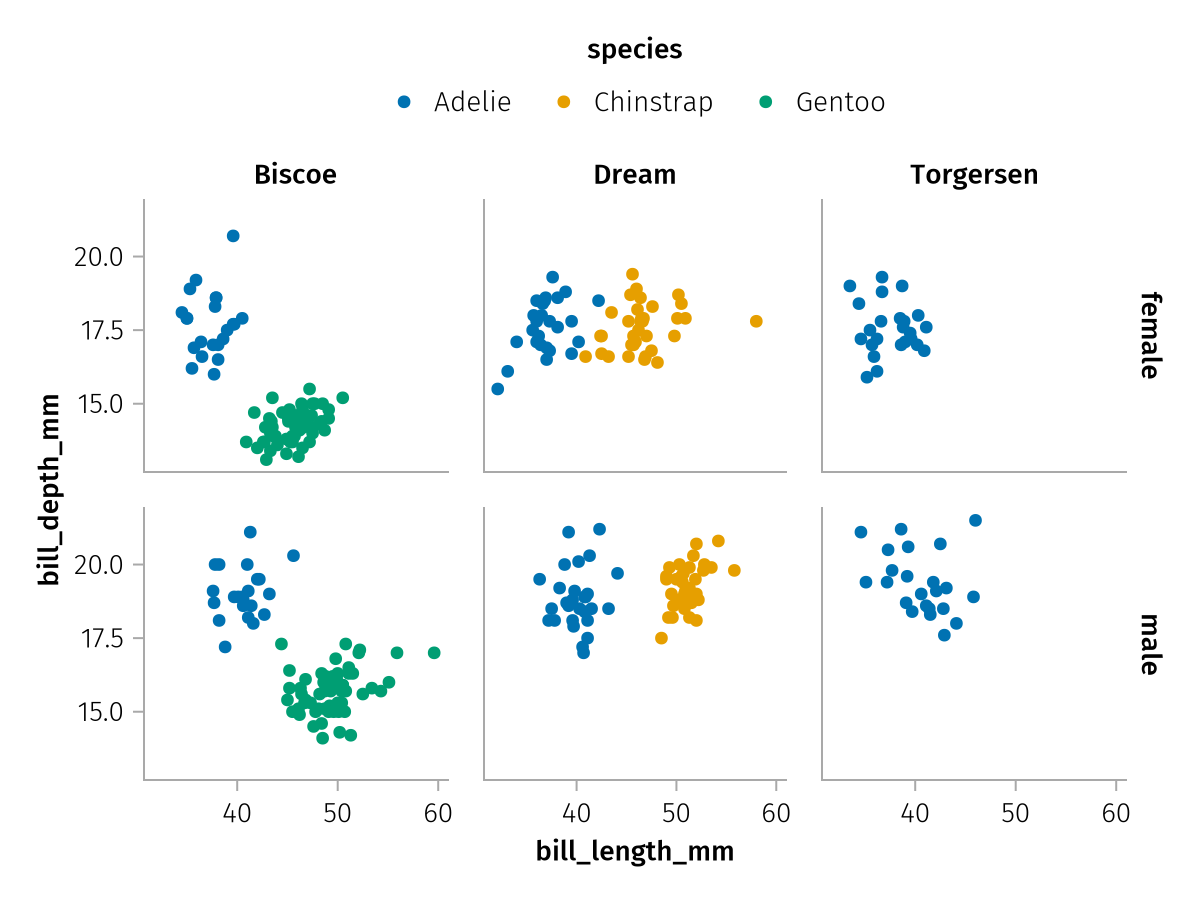
Order
In case there are multiple legend groups, you might want to modify the order in which they appear. You specify the names of the scales to refer to the legend groups, by default these are the aesthetics of the scales:
two_legend_groups = data(penguins) *
    mapping(:bill_length_mm, :bill_depth_mm, color = :species, marker = :island) *
    visual(Scatter)

draw(two_legend_groups, legend = (; order = [:Marker, :Color]))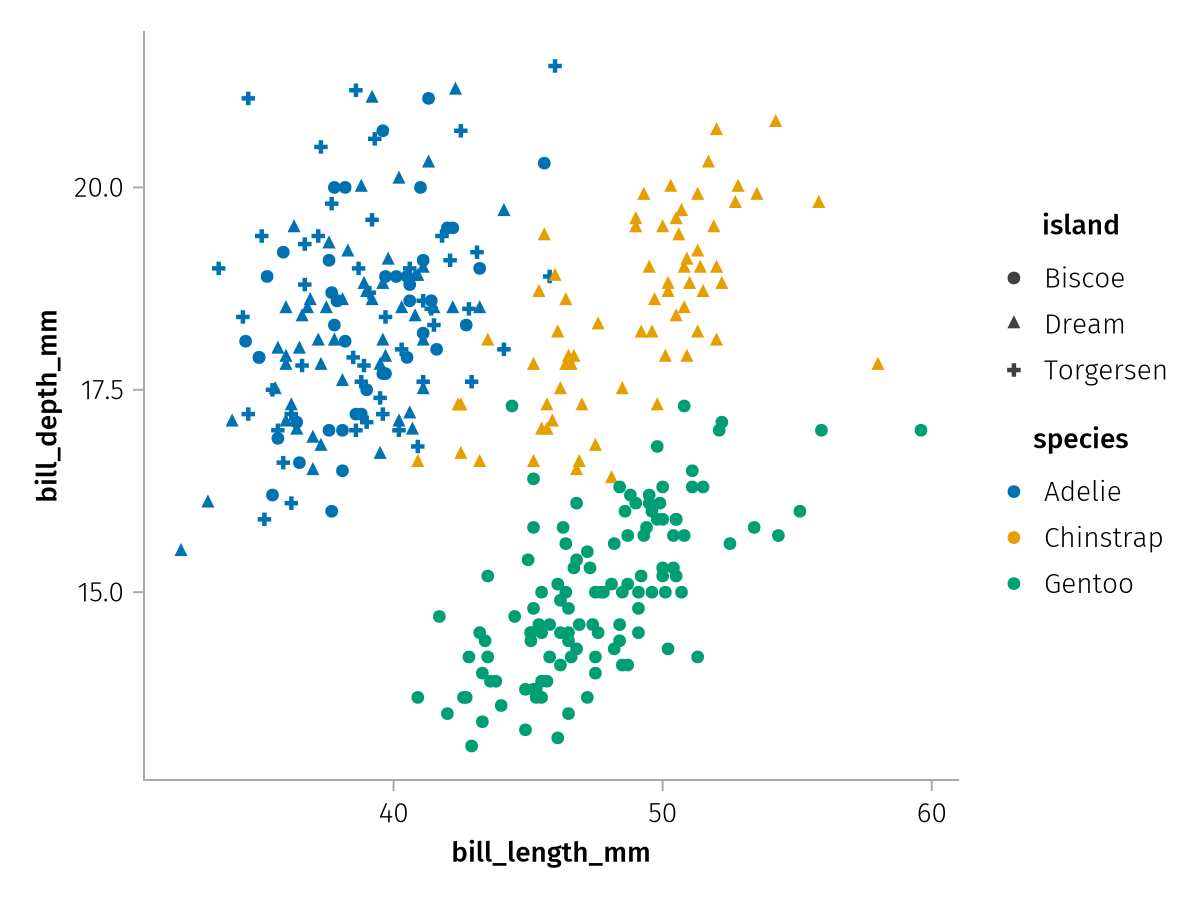
You can even merge together multiple legend groups in case you whish to have a more condensed legend:
draw(two_legend_groups, legend = (; order = [[:Marker, :Color]]))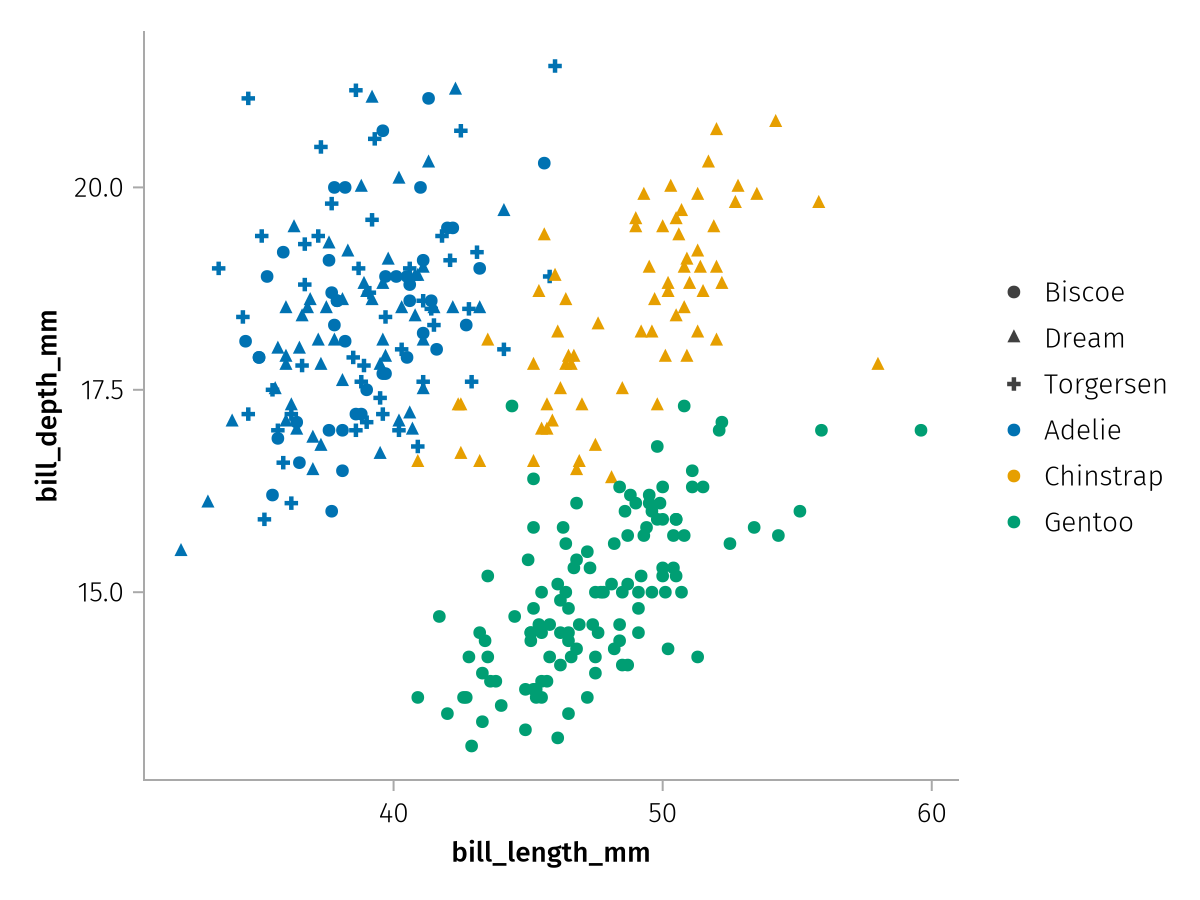
You can also assign new titles to such merged groups using the Pair syntax:
draw(two_legend_groups, legend = (; order = [[:Marker, :Color] => "Island &\nSpecies"]))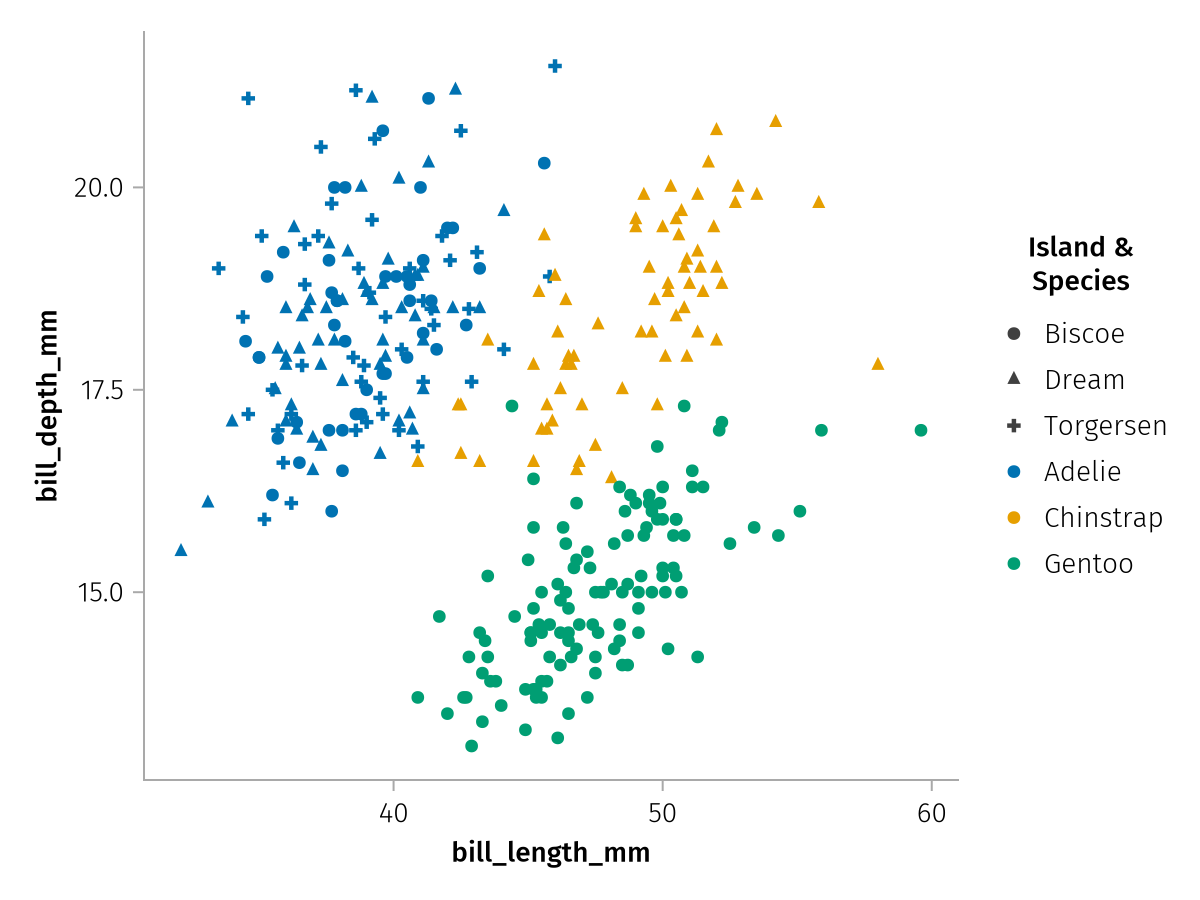
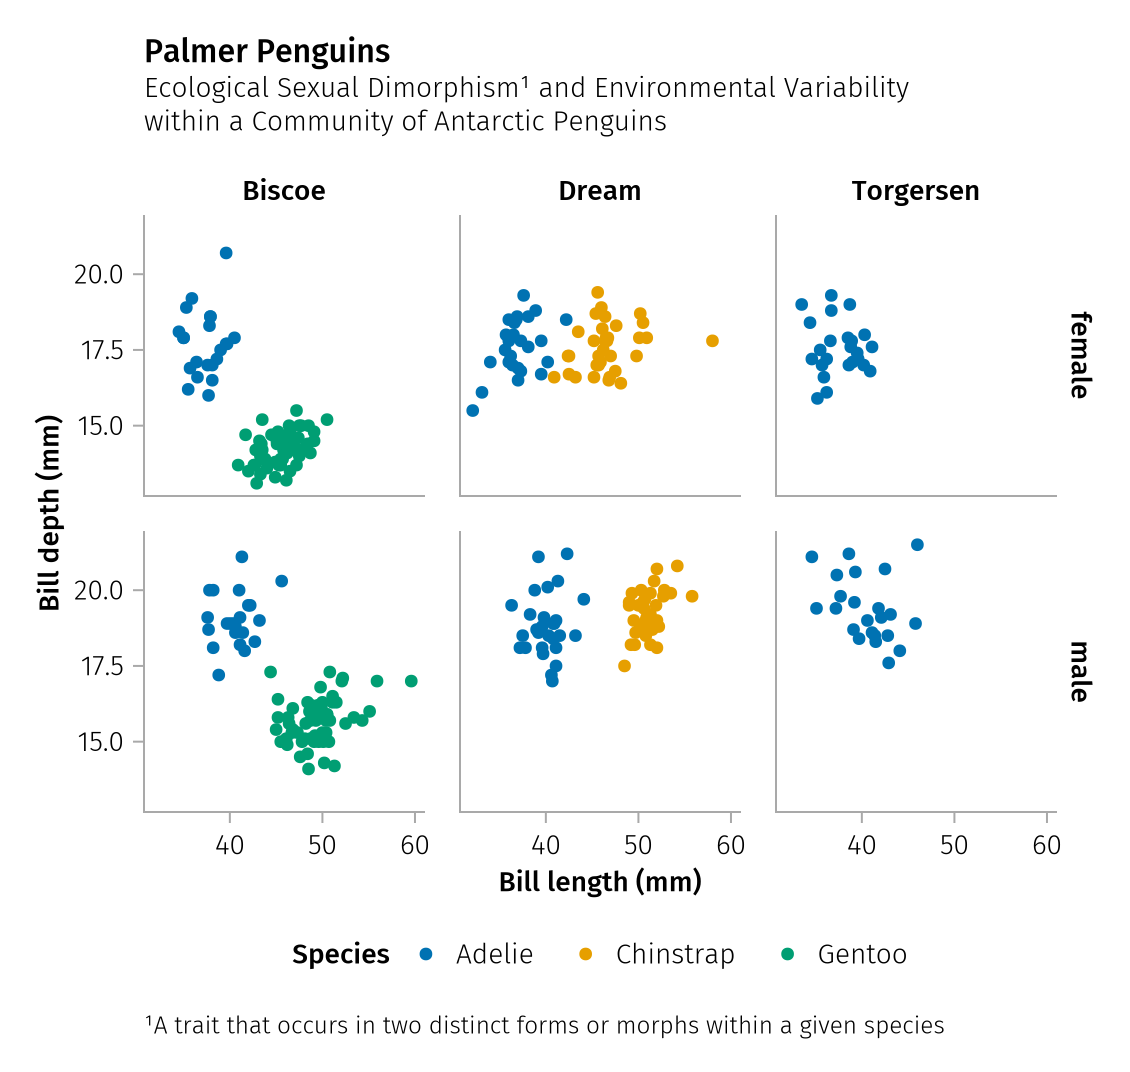
Summary
Combining all the settings, it is easy to reach a high quality end product that should be suitable for publication:
draw(
    spec,
    scales(
        X = (; label = "Bill length (mm)"),
        Y = (; label = "Bill depth (mm)"),
        Color = (; label = "Species"),
    );
    figure = (;
        title = "Palmer Penguins",
        subtitle = """
            Ecological Sexual Dimorphism¹ and Environmental Variability
            within a Community of Antarctic Penguins""",
        footnotes = ["¹A trait that occurs in two distinct forms or morphs within a given species"]
    ),
    axis = (;
        width = 140,
        height = 140
    ),
    legend = (; position = :bottom, titleposition = :left, framevisible = false)
)
Check out the next tutorial to learn more about on-the-fly data transformations with mapping.