Gallery
Basic visualizations
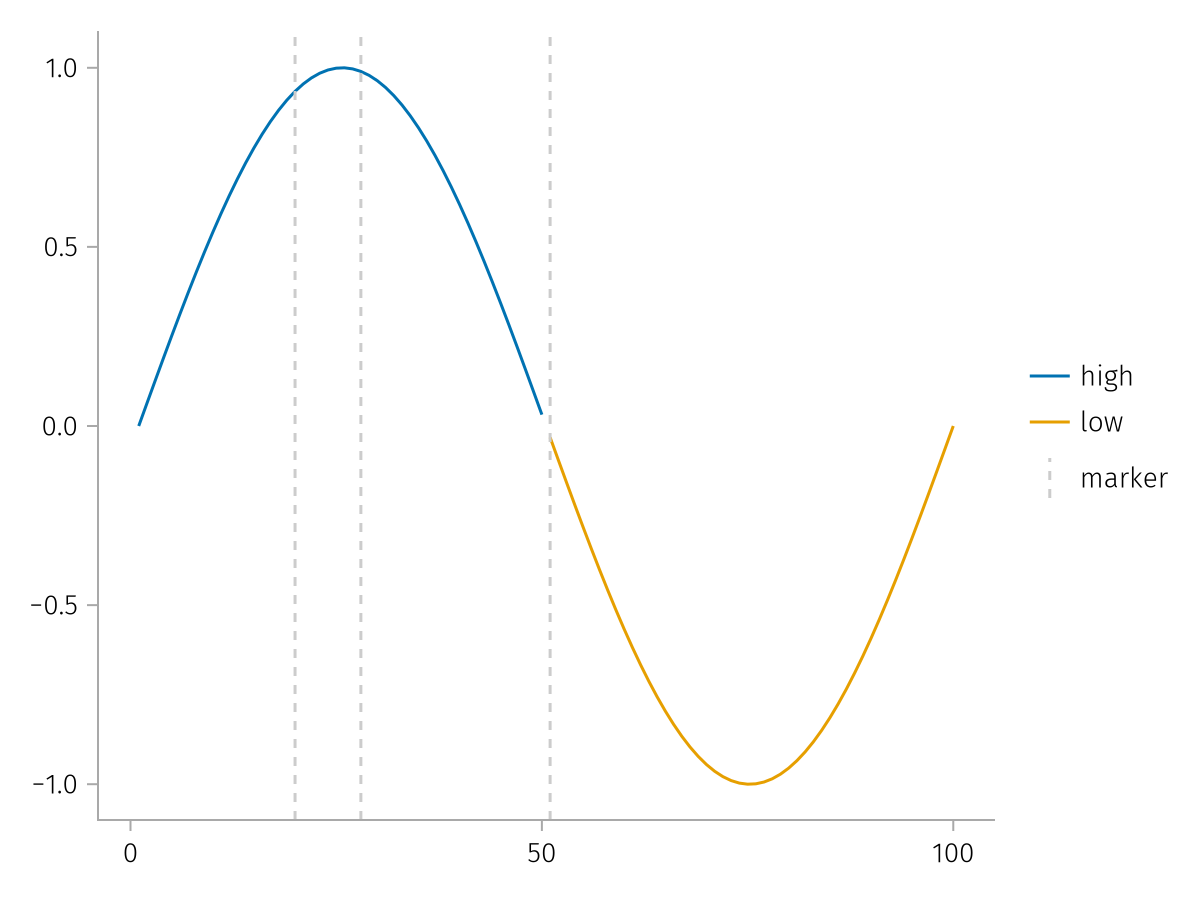
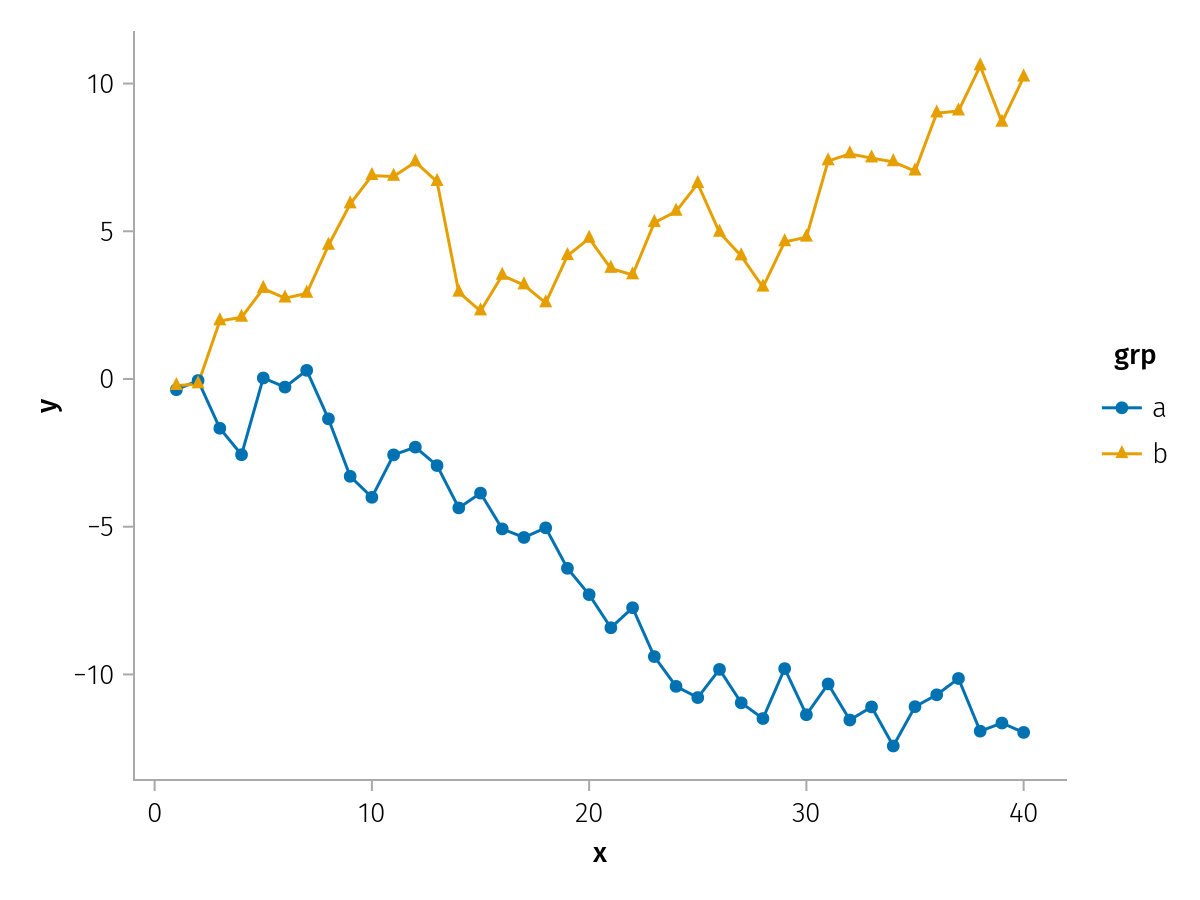
Lines and markers
Basic linear and scatter plots.
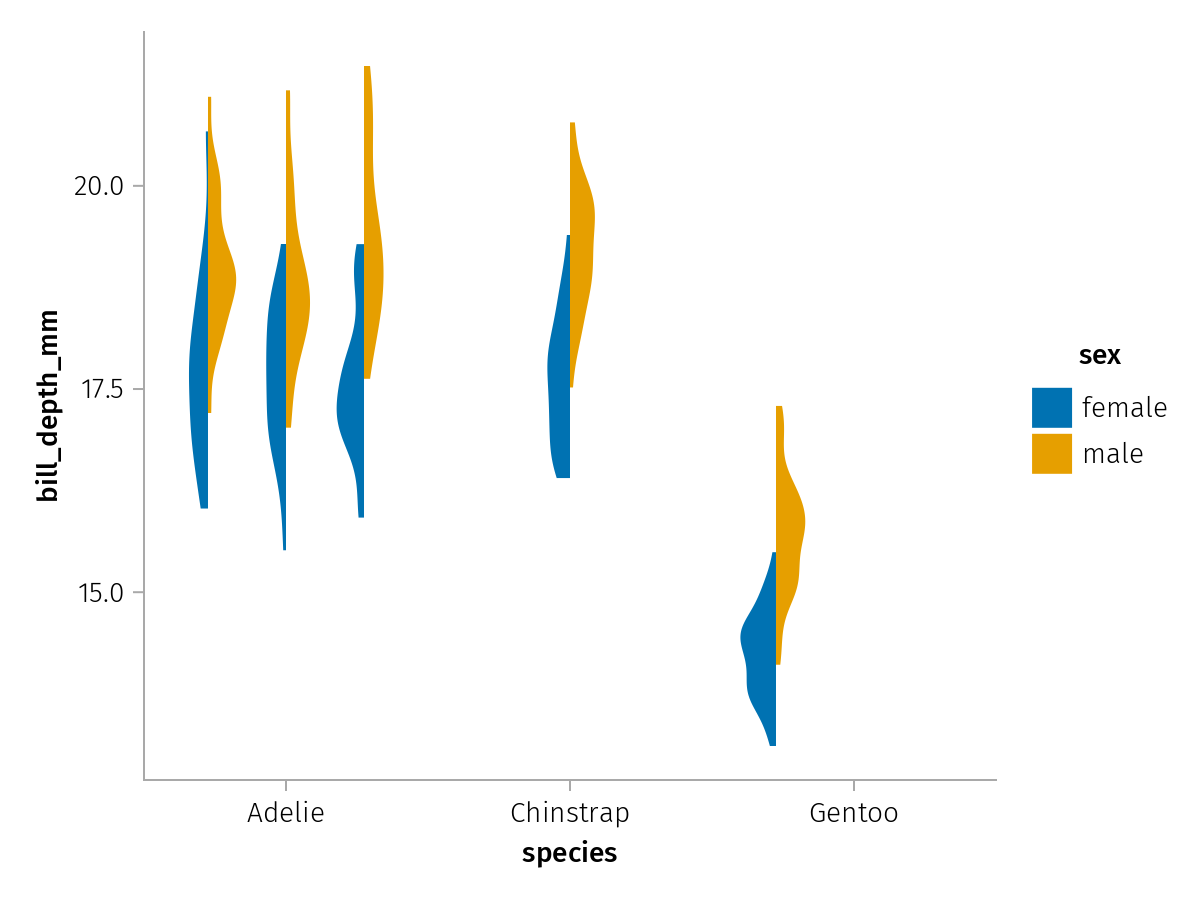
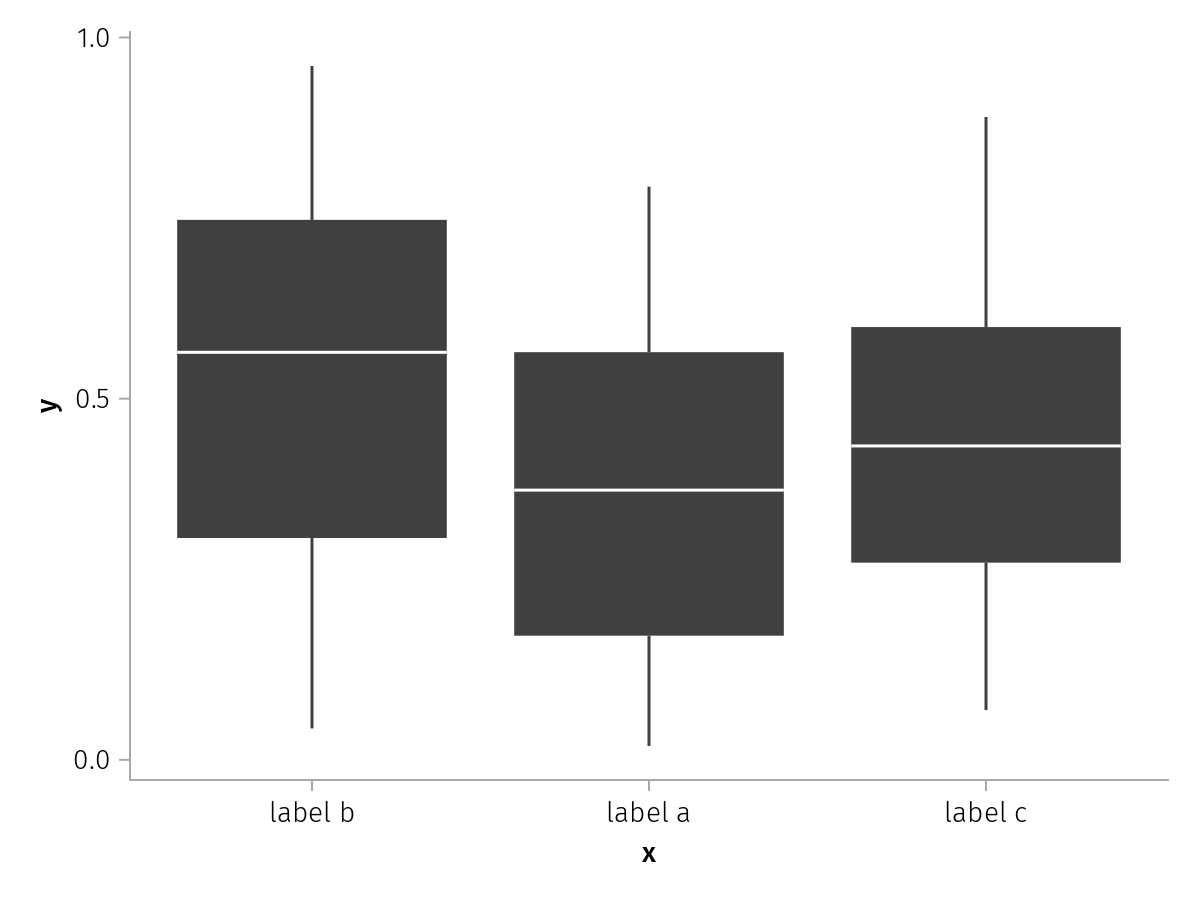
Statistical visualizations
Violin plot, boxplot, qqplot.
Statistical analyses
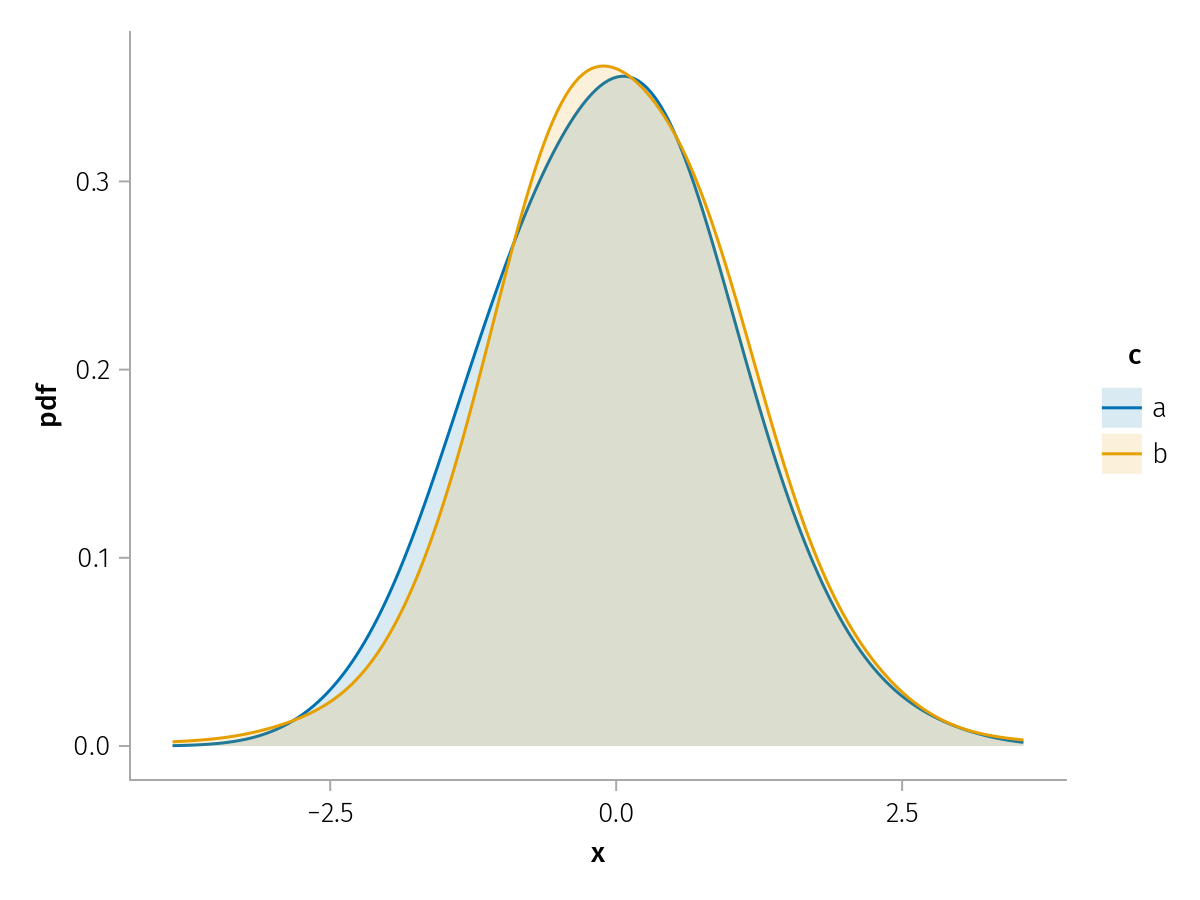
Density plots
Visualizing kernel density estimation of data.
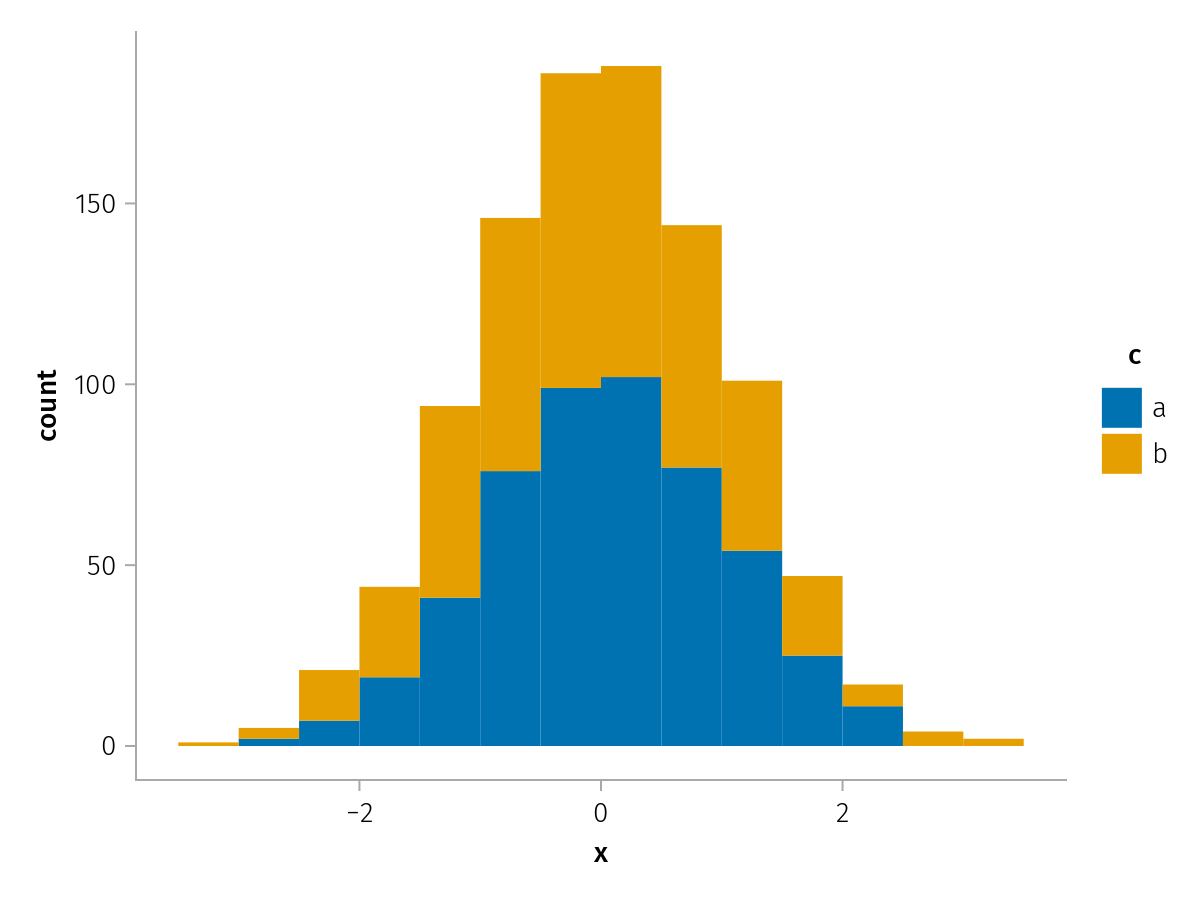
Histograms
Computing 1- and 2-dimensional histograms.
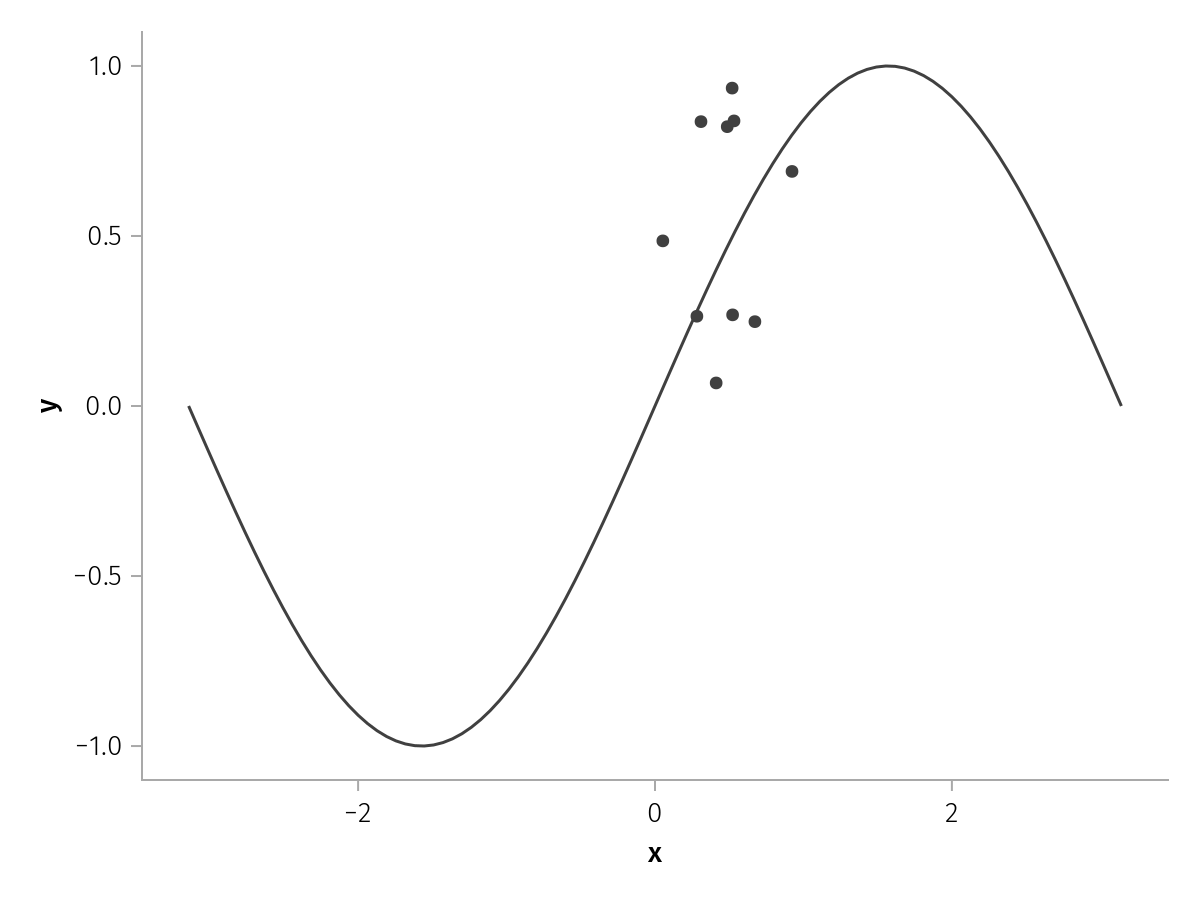
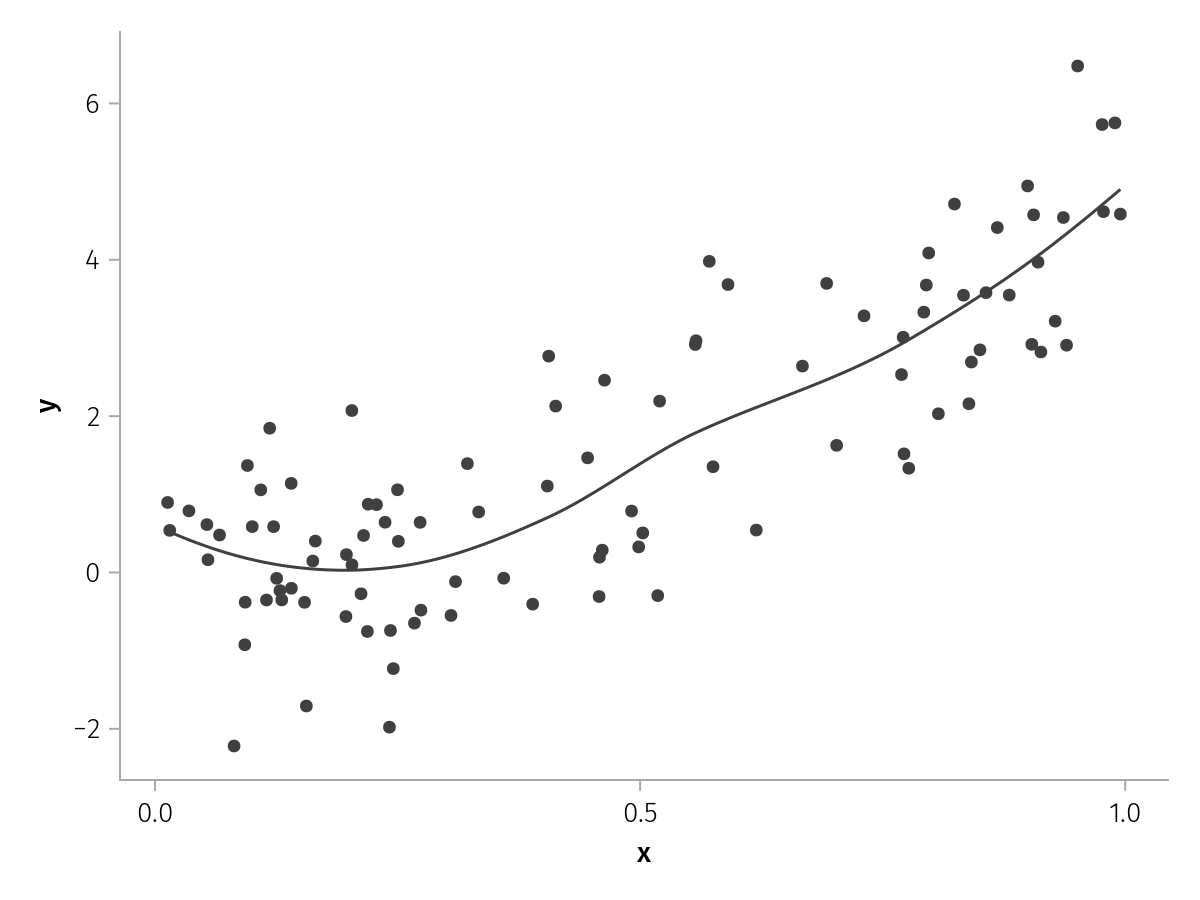
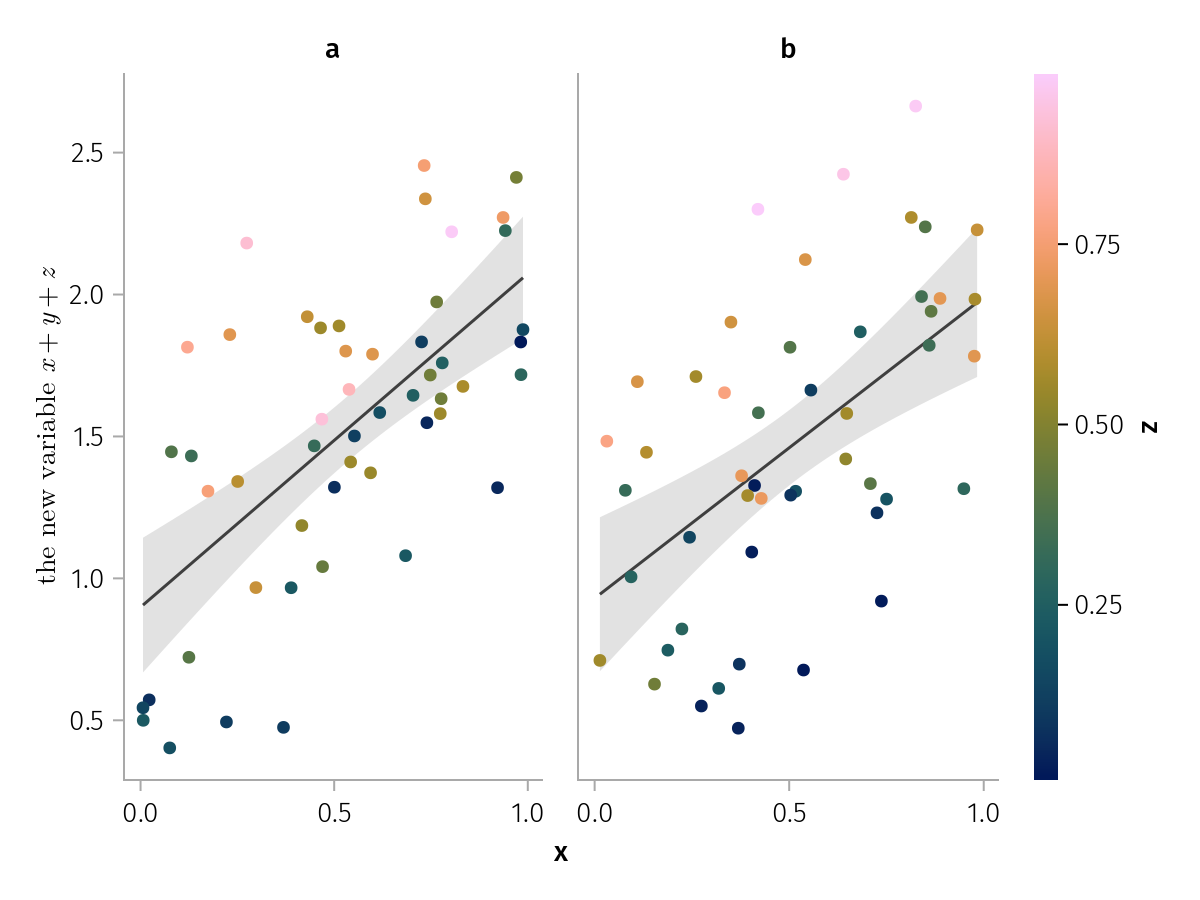
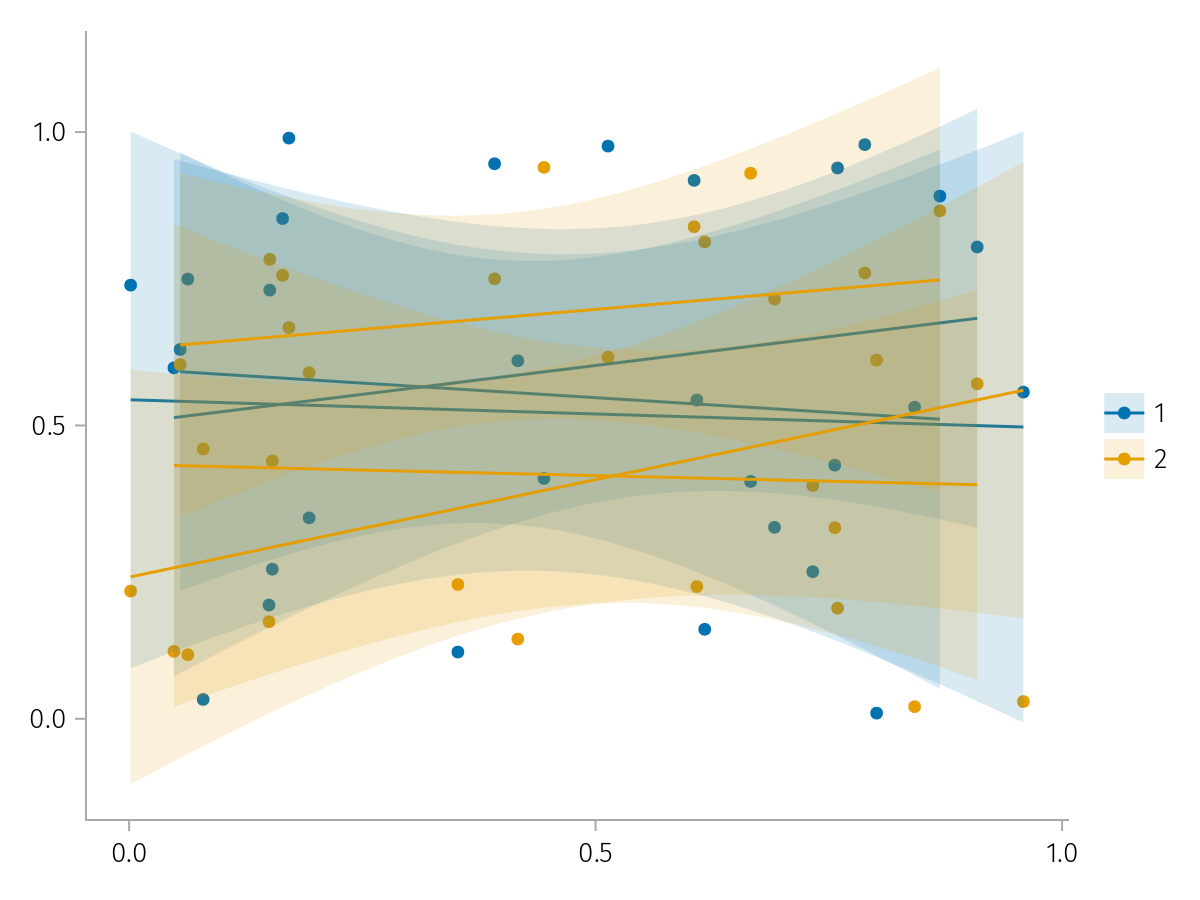
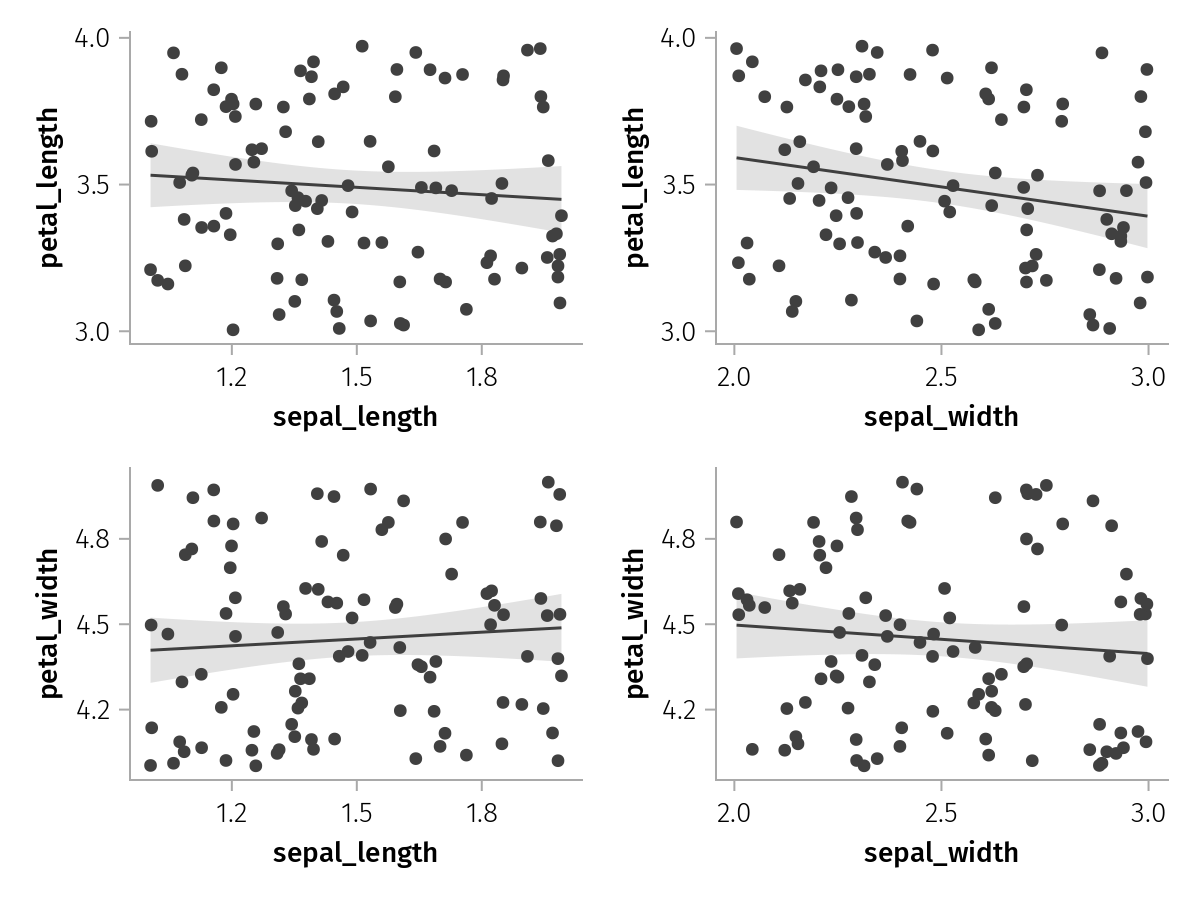
Regression plots
Linear and nonlinear regressions.
Data manipulations
Renaming and transforming variables
Transforming data before generating the plot.
Using mapping without tabular data
Passing columnar data directly to `mapping`.
Pre-grouped data
Working with arrays of arrays.
Wide data
Working with data in the wide format.
Scales
Some advanced keywords to tweak the plot
Discrete scales
Sorting and renaming categorical variables.
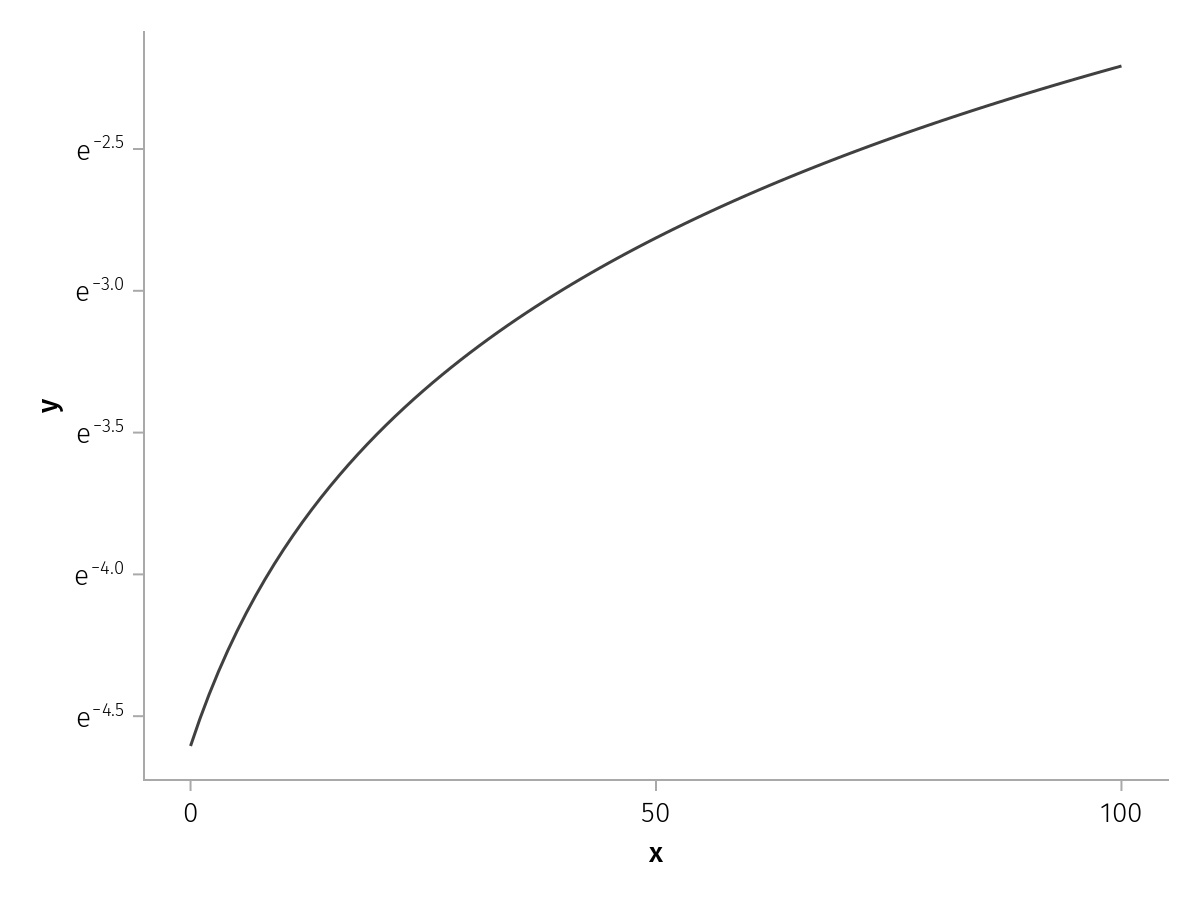
Continuous scales
Applying nonlinear transformations.
Custom scales
Custom palettes and custom attributes.
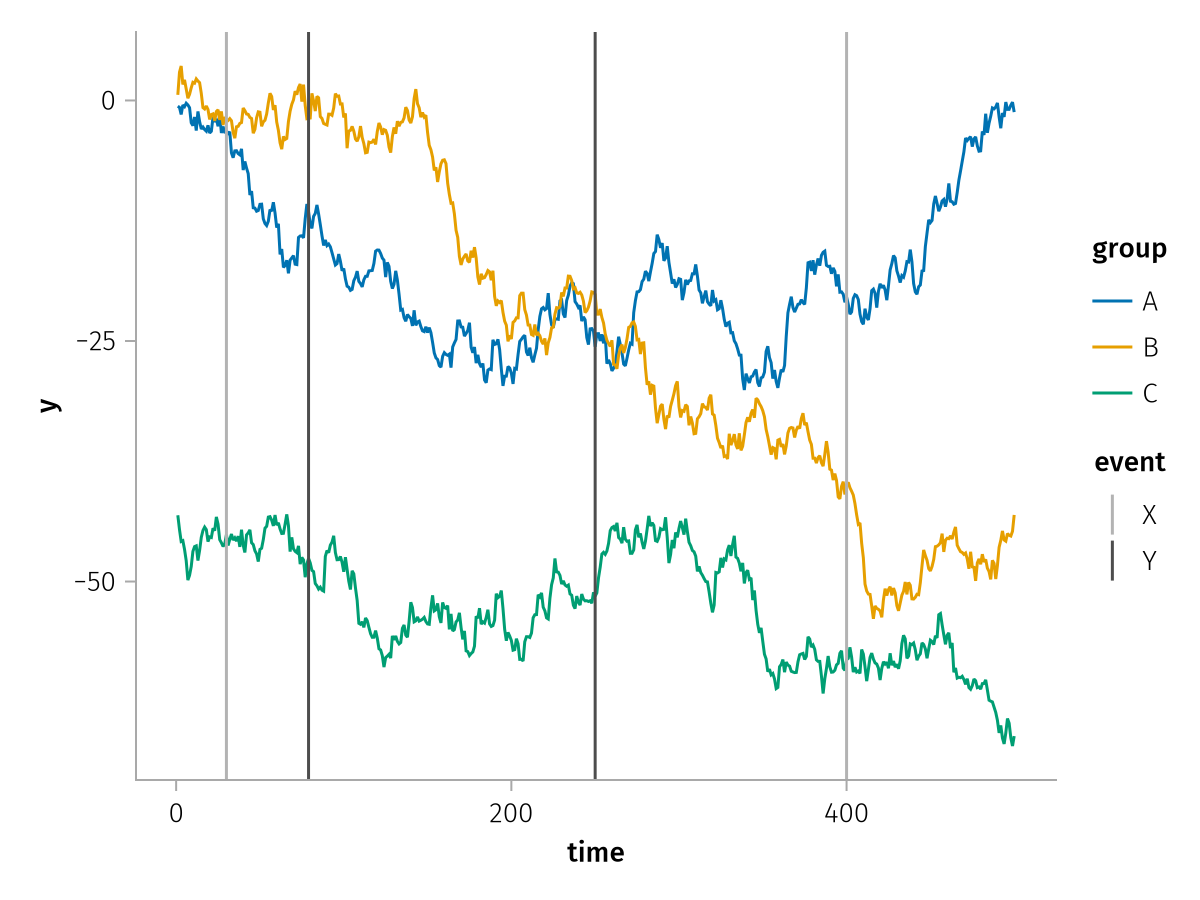
Secondary scales
Categorical and continuous scales in the same plot.
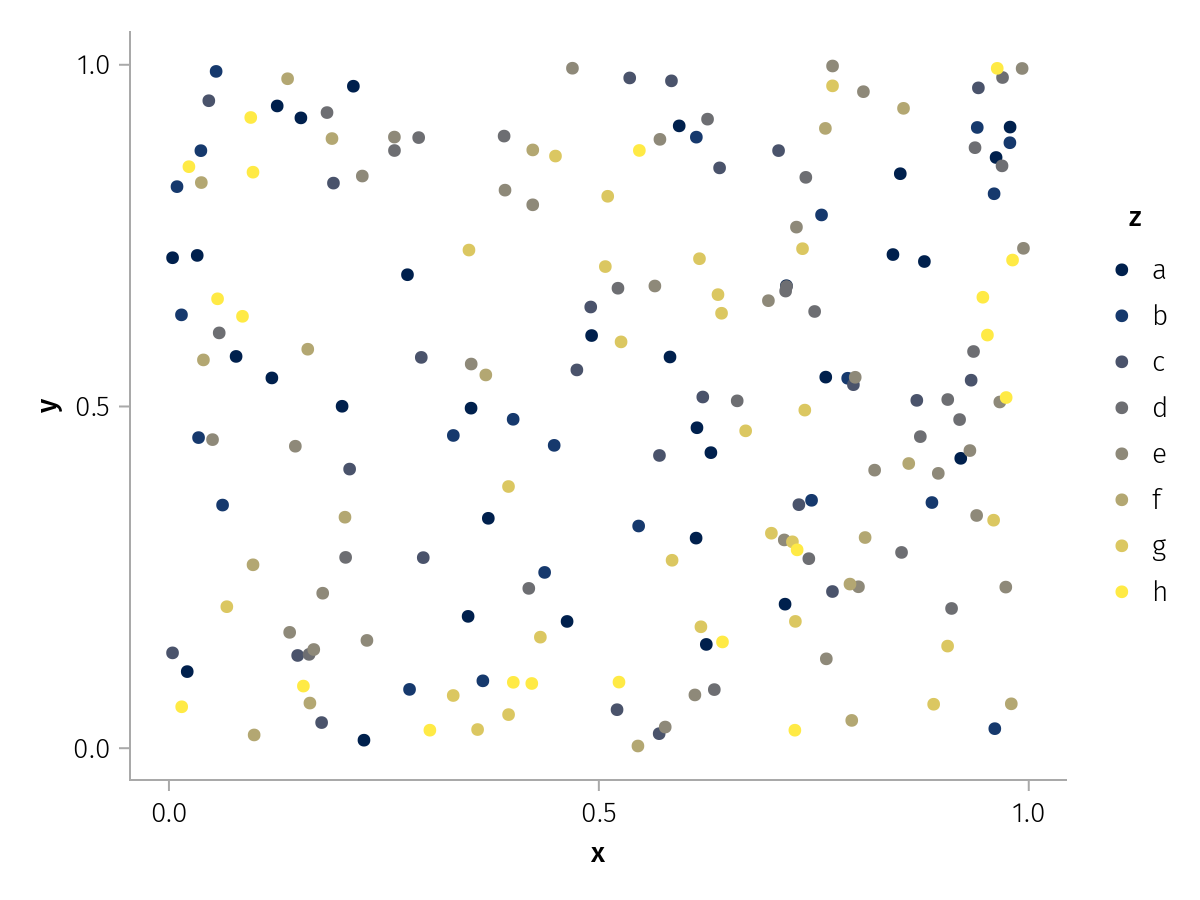
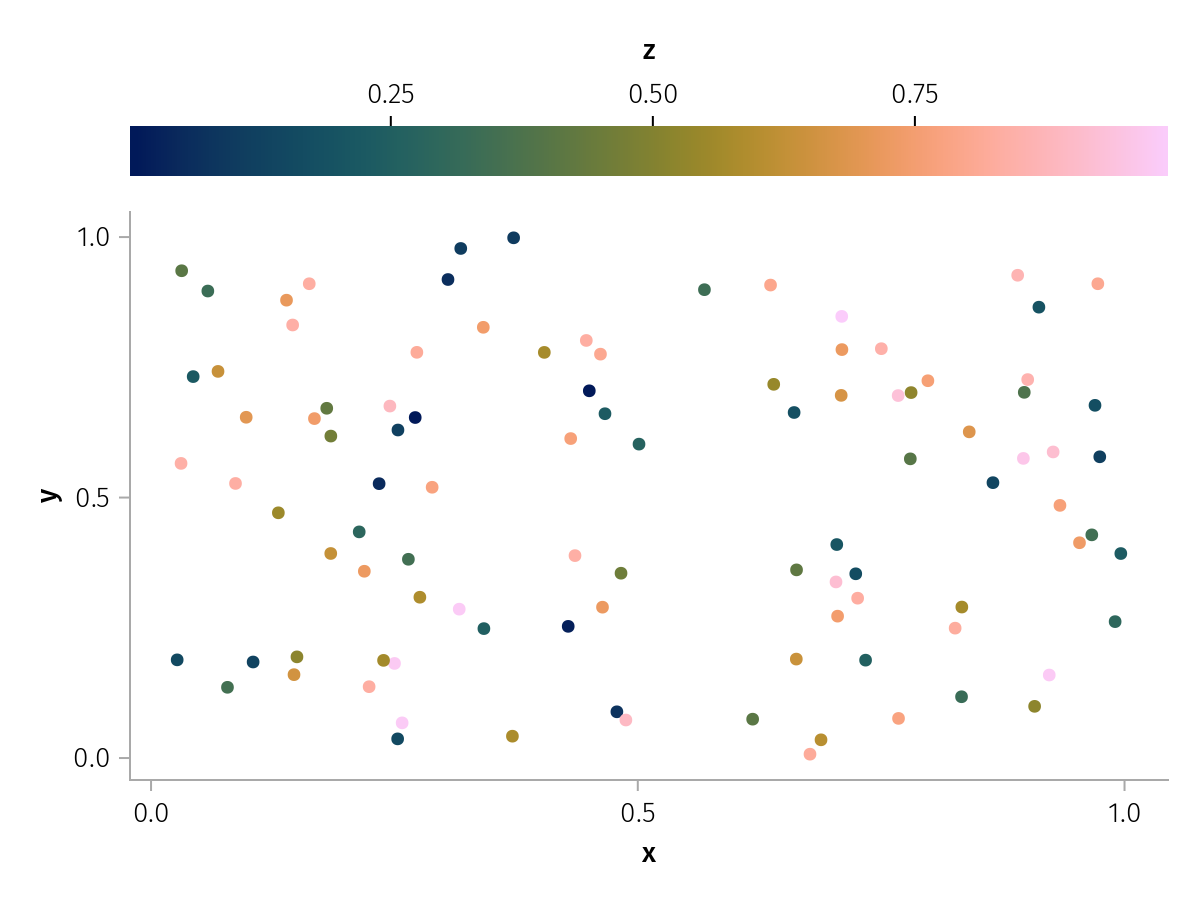
Multiple color scales
Categorical and continuous scales in the same plot.
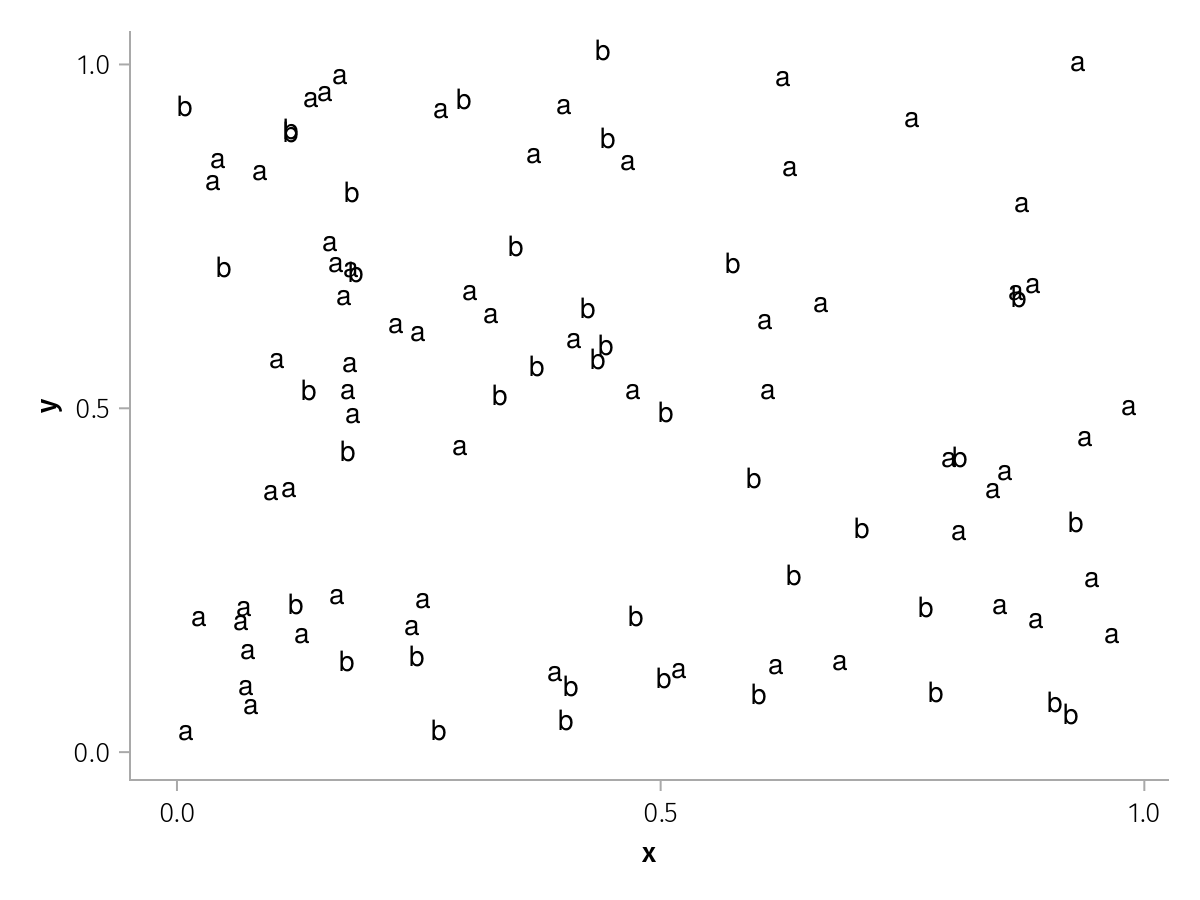
Pre-scaled data
Pass data to the plot as is.
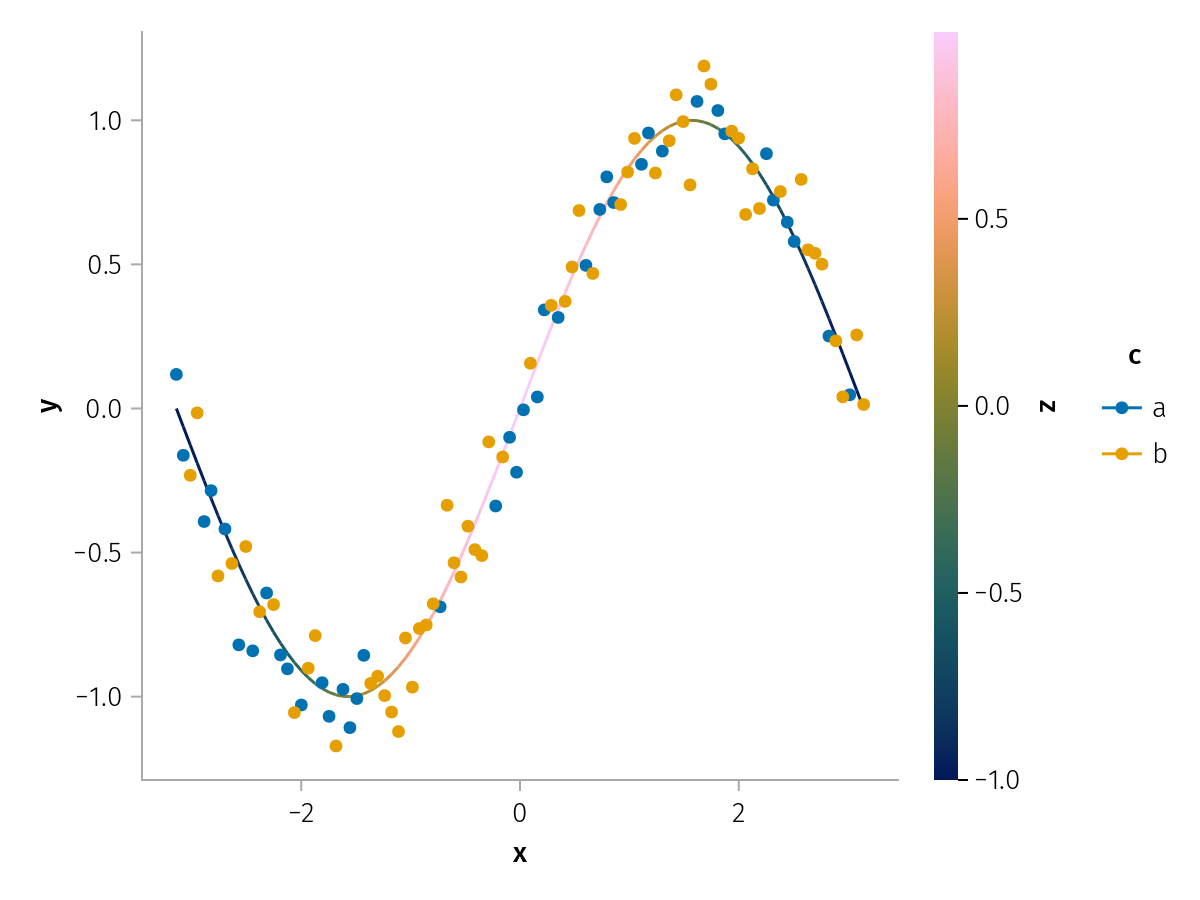
Legend merging
Multiple scales for the same variable.
Customization
Some advanced keywords to tweak the plot
Axis tweaking
Setting axis attributes.
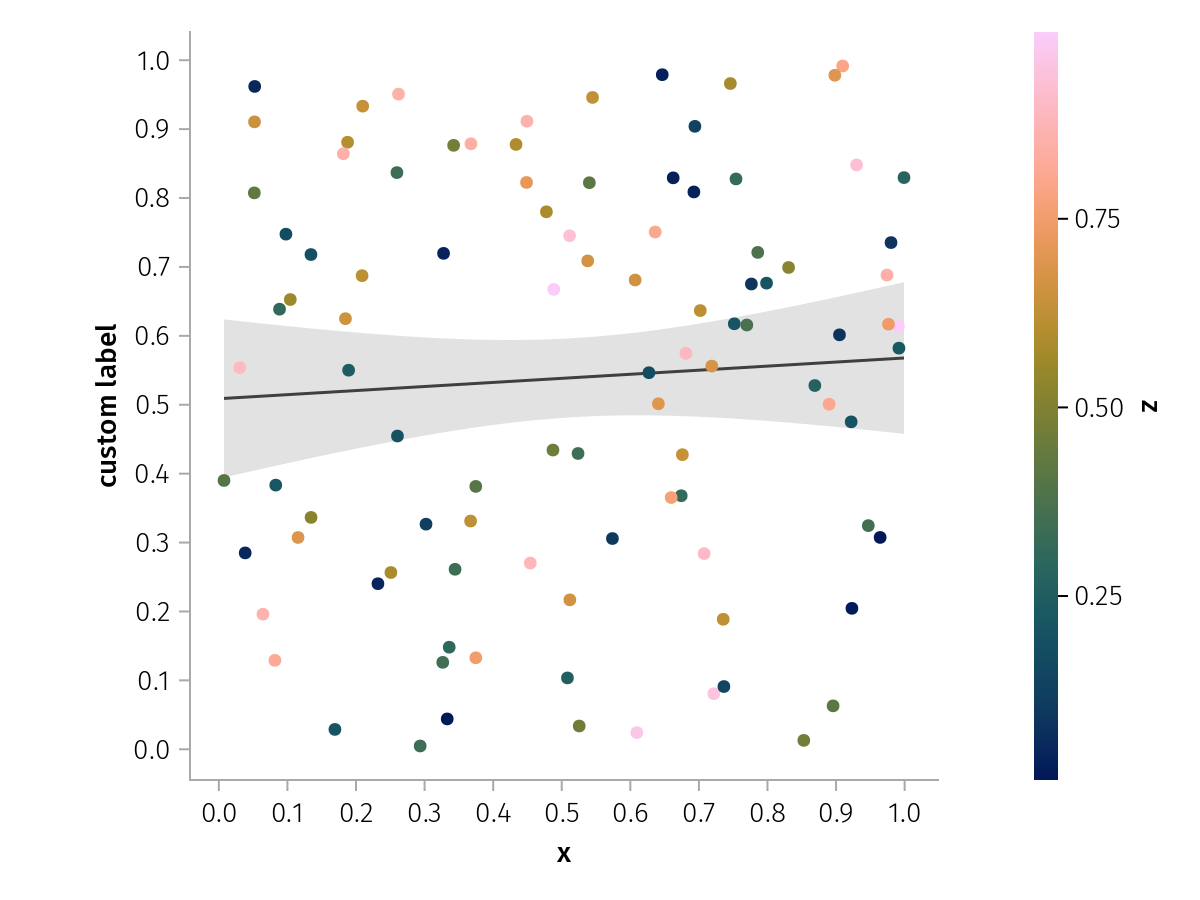
Figure tweaking
Setting figure attributes.
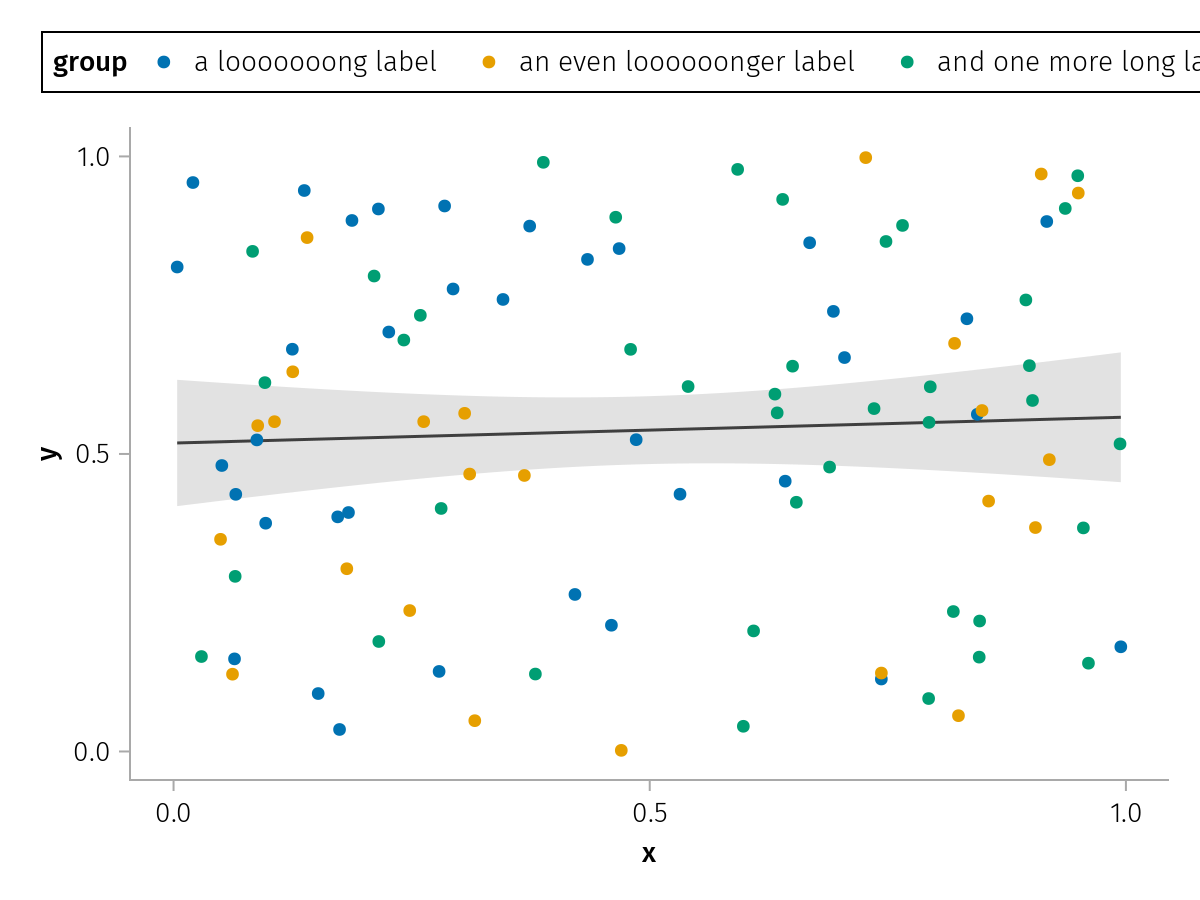
Legend tweaking
Setting legend attributes.
Colorbar tweaking
Setting colorbar attributes.
Layout
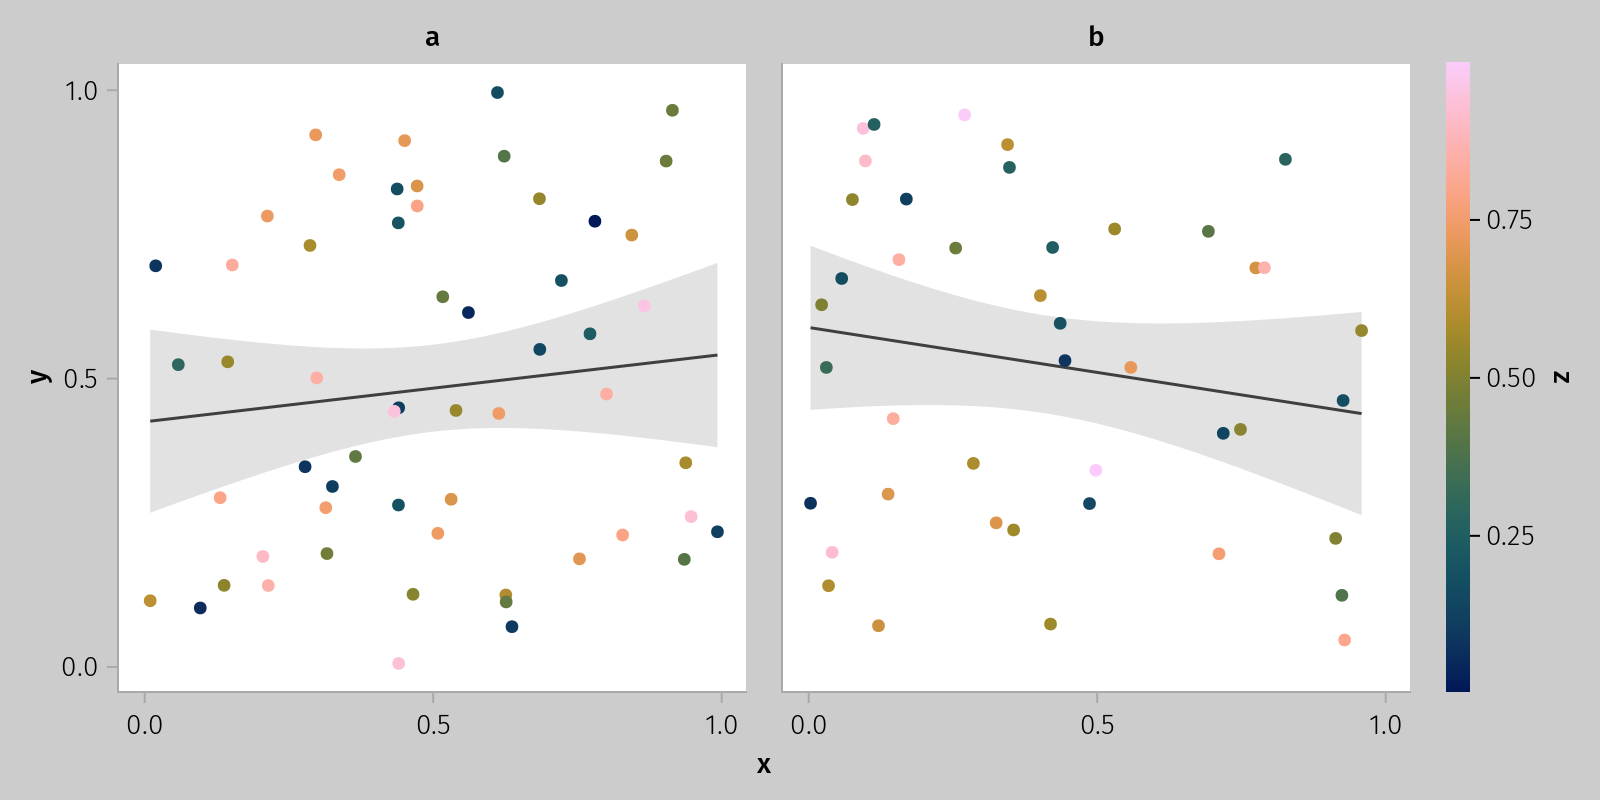
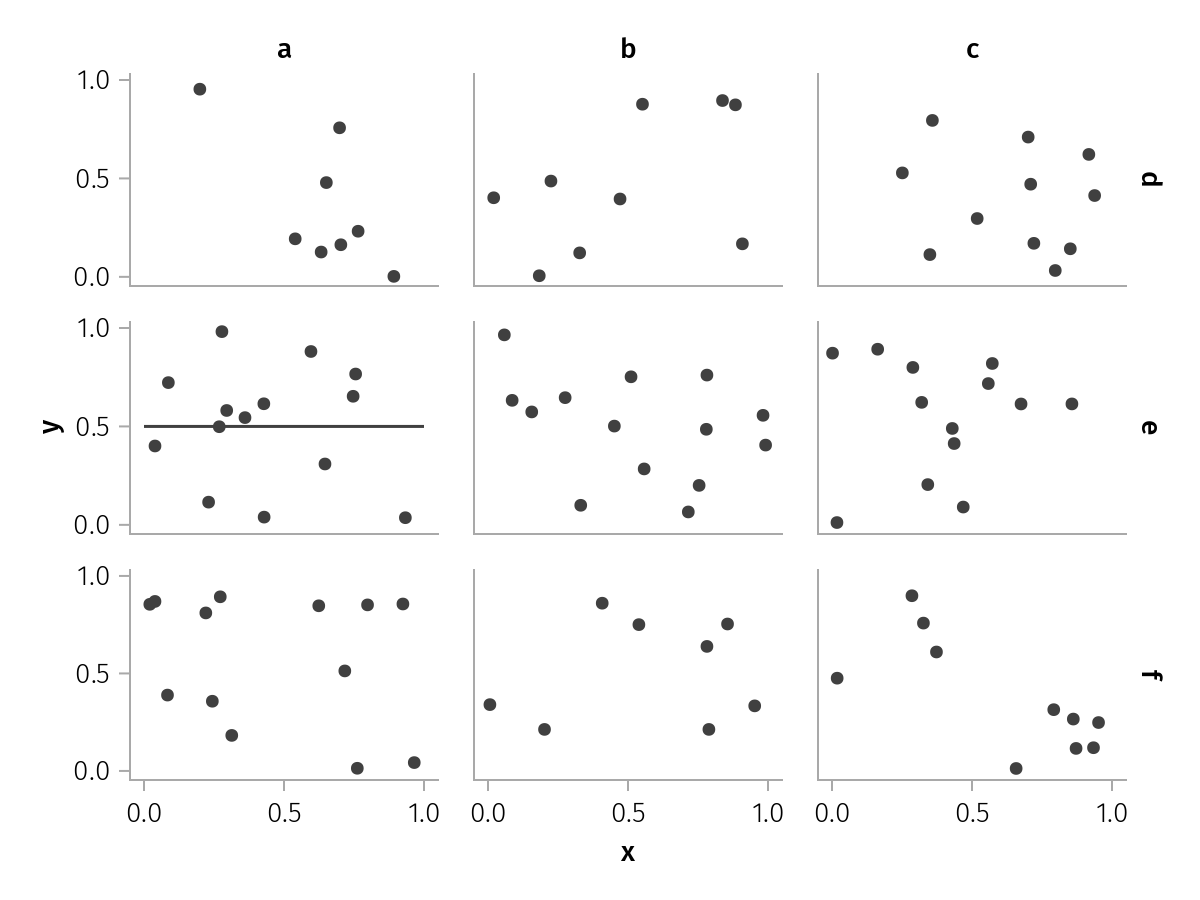
Faceting
Generating a grid of plots.
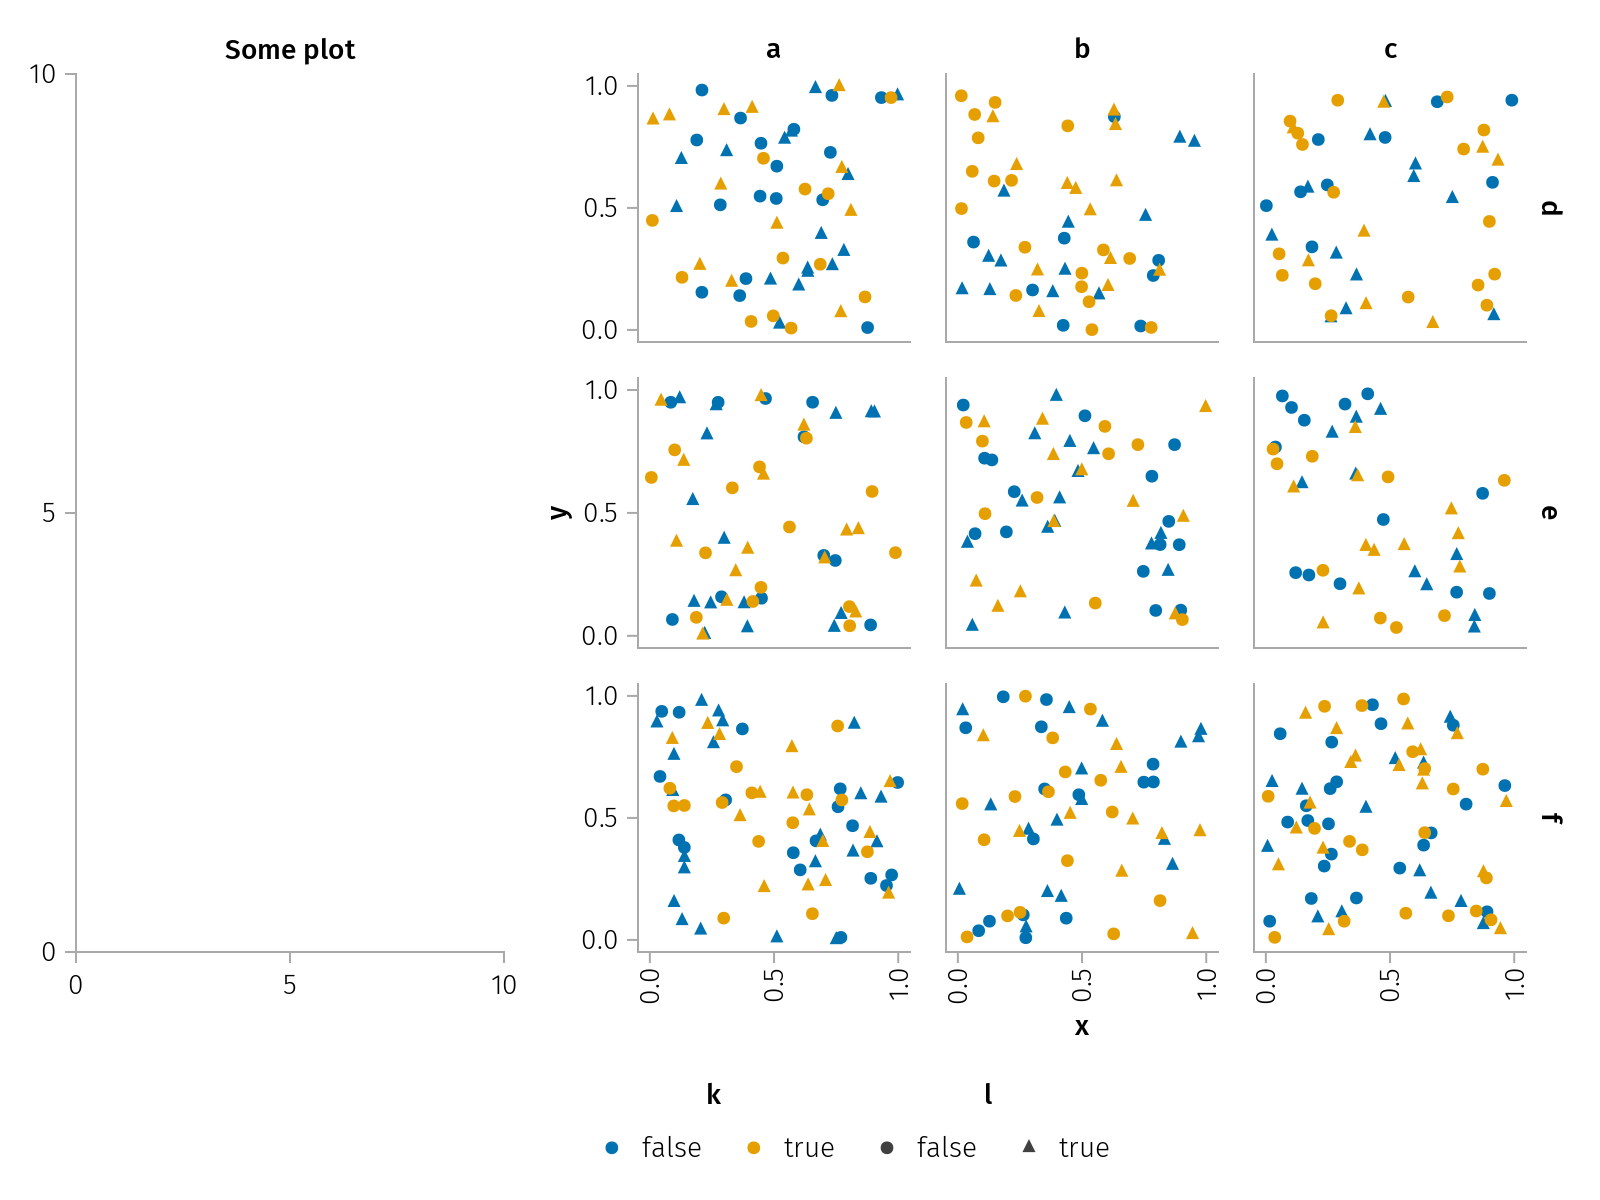
Nested layouts
AlgebraOfGraphics plots within a Makie figure.
Applications
Example applications with different types of data
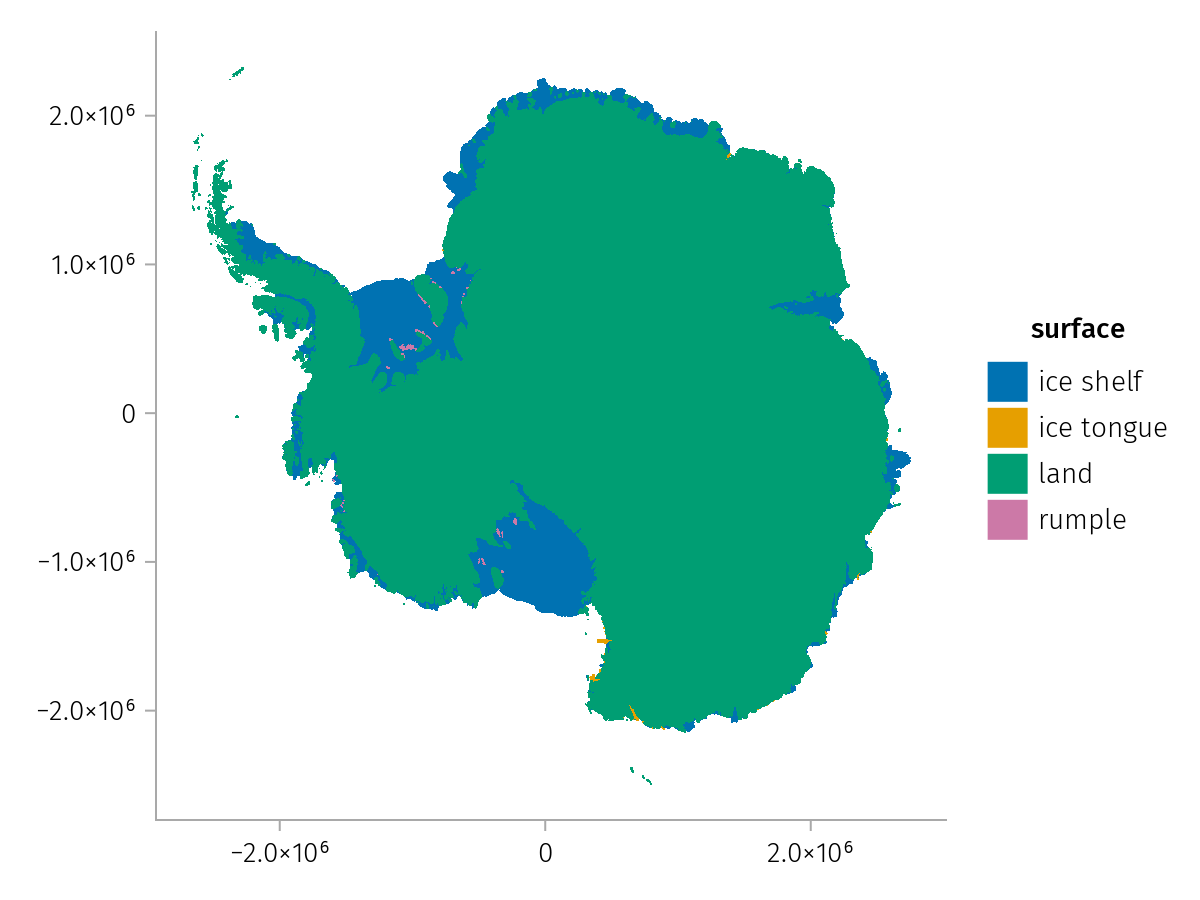
Geographic data
Antarctic coastline.
Geometries
Visualizing geometries.
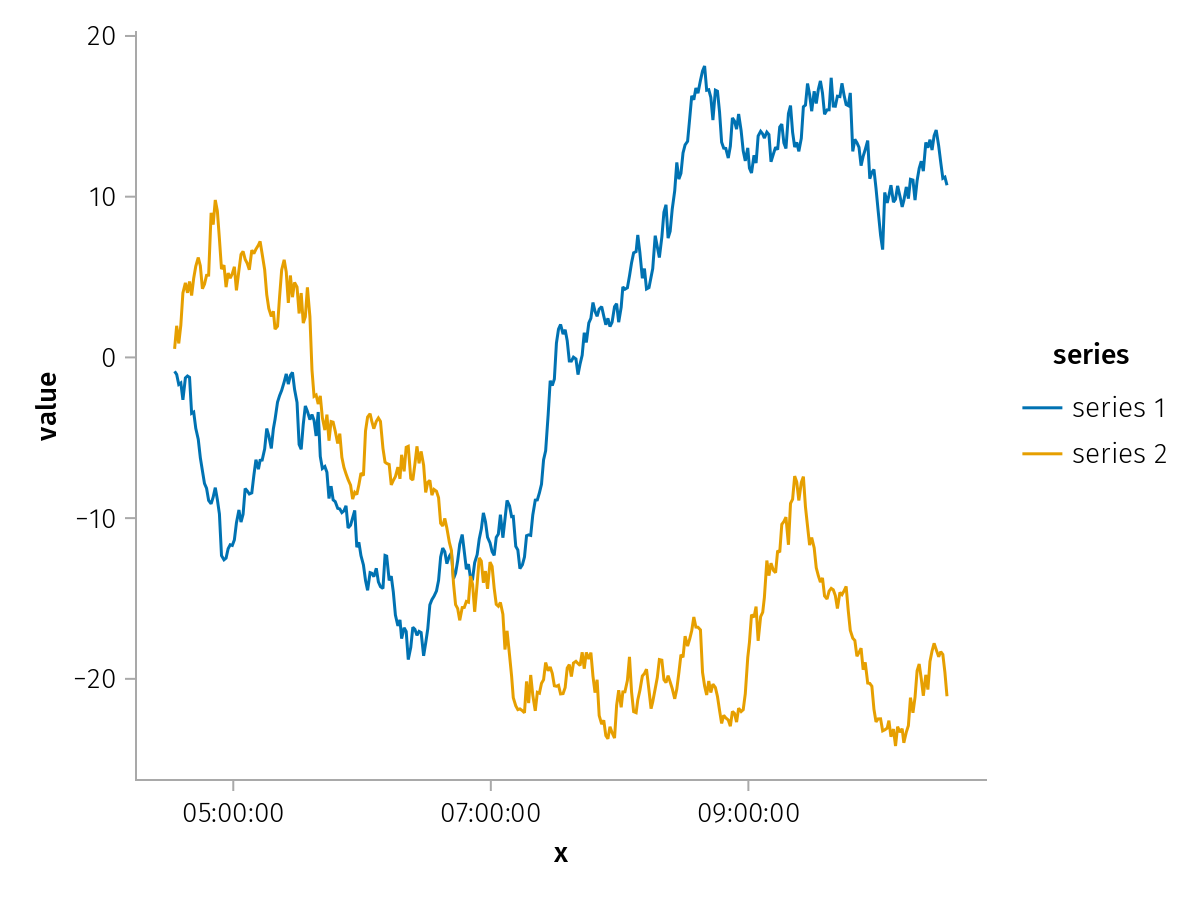
Time series
Visualizing time series data.