Units
AlgebraOfGraphics supports input data with units, currently Unitful.jl and DynamicQuantities.jl have extensions implemented.
Let's first create a unitful version of the penguins dataset:
using AlgebraOfGraphics
using CairoMakie
using Unitful
using DataFrames

df = DataFrame(AlgebraOfGraphics.penguins())
df.bill_length = df.bill_length_mm .* u"mm"
df.bill_depth = uconvert.(u"cm", df.bill_depth_mm .* u"mm")
df.flipper_length = df.flipper_length_mm .* u"mm"
df.body_mass = df.body_mass_g .* u"g"
select!(df, Not([:bill_length_mm, :bill_depth_mm, :flipper_length_mm, :body_mass_g]))

first(df, 5)| Row | species | island | sex | bill_length | bill_depth | flipper_length | body_mass |
|---|---|---|---|---|---|---|---|
| String | String | String | Quantity… | Quantity… | Quantity… | Quantity… | |
| 1 | Adelie | Torgersen | male | 39.1 mm | 1.87 cm | 181 mm | 3750 g |
| 2 | Adelie | Torgersen | female | 39.5 mm | 1.74 cm | 186 mm | 3800 g |
| 3 | Adelie | Torgersen | female | 40.3 mm | 1.8 cm | 195 mm | 3250 g |
| 4 | Adelie | Torgersen | female | 36.7 mm | 1.93 cm | 193 mm | 3450 g |
| 5 | Adelie | Torgersen | male | 39.3 mm | 2.06 cm | 190 mm | 3650 g |
When we plot columns with units, the units are automatically appended to the respective labels:
spec = data(df) *
    mapping(:bill_length, :bill_depth, color = :body_mass) *
    visual(Scatter)
draw(spec)
Labels are separate from units, so we can relabel without affecting the unit suffixes:
spec = data(df) *
    mapping(:bill_length => "Bill length", :bill_depth => "Bill depth", color = :body_mass => "Body mass") *
    visual(Scatter)
draw(spec)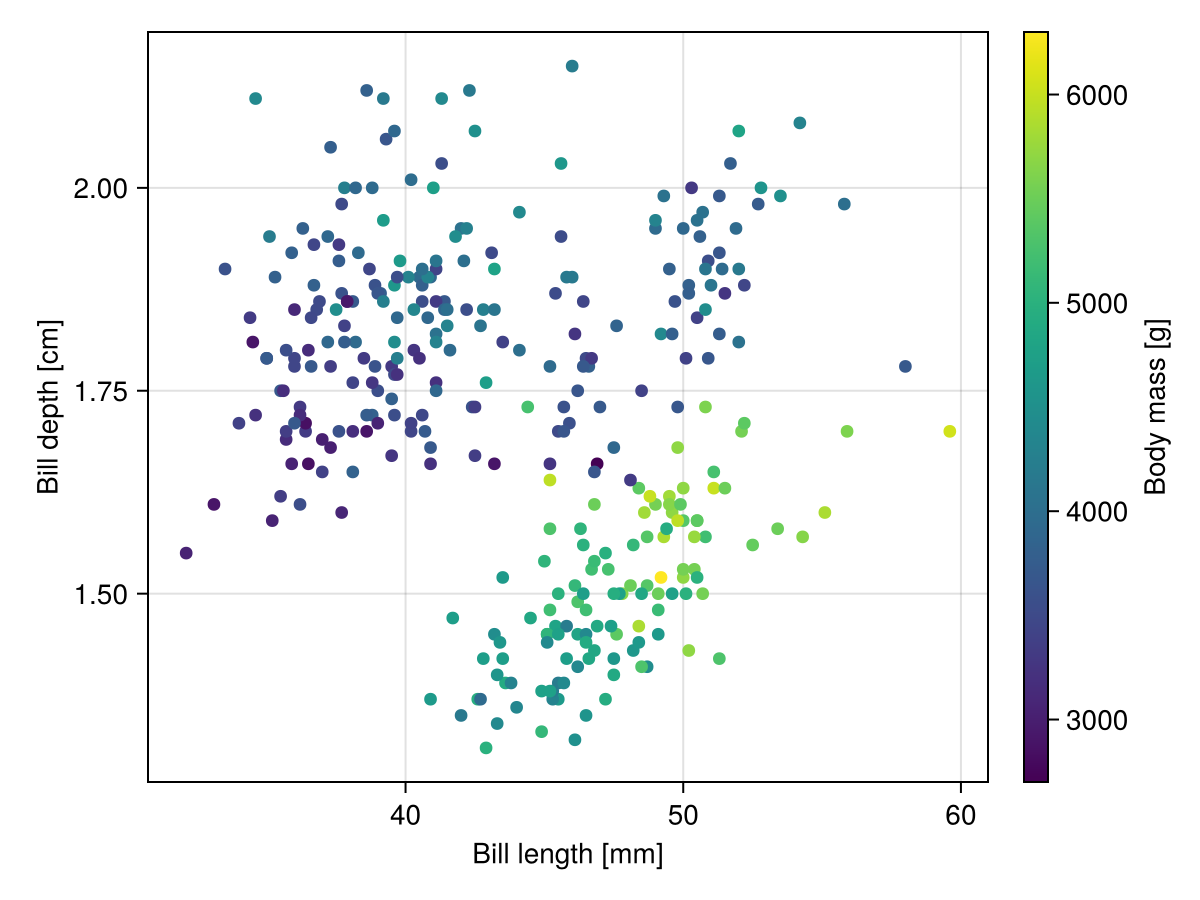
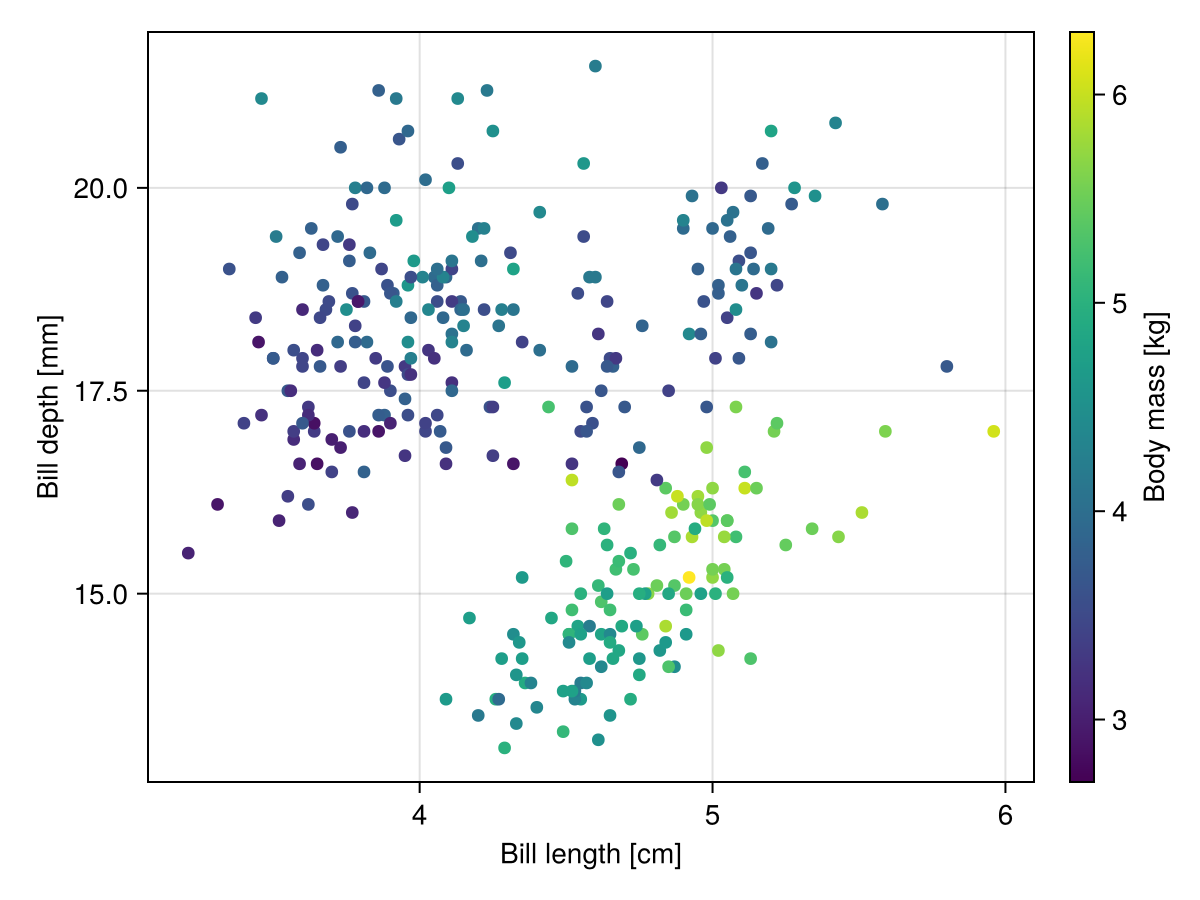
We can choose a different display unit per scale via the unit scale property:
draw(
    spec,
    scales(
        X = (; unit = u"cm"),
        Y = (; unit = u"mm"),
        Color = (; unit = u"kg")
    )
)
If we plot different units on the same scale, all the units have to be dimensionally compatible and will be auto-converted to the same unit.
layer1 = data(df) * mapping(:bill_length, color = direct("Bill length")) * visual(Density)
layer2 = data(df) * mapping(:bill_depth, color = direct("Bill depth")) * visual(Density)

draw(layer1 + layer2)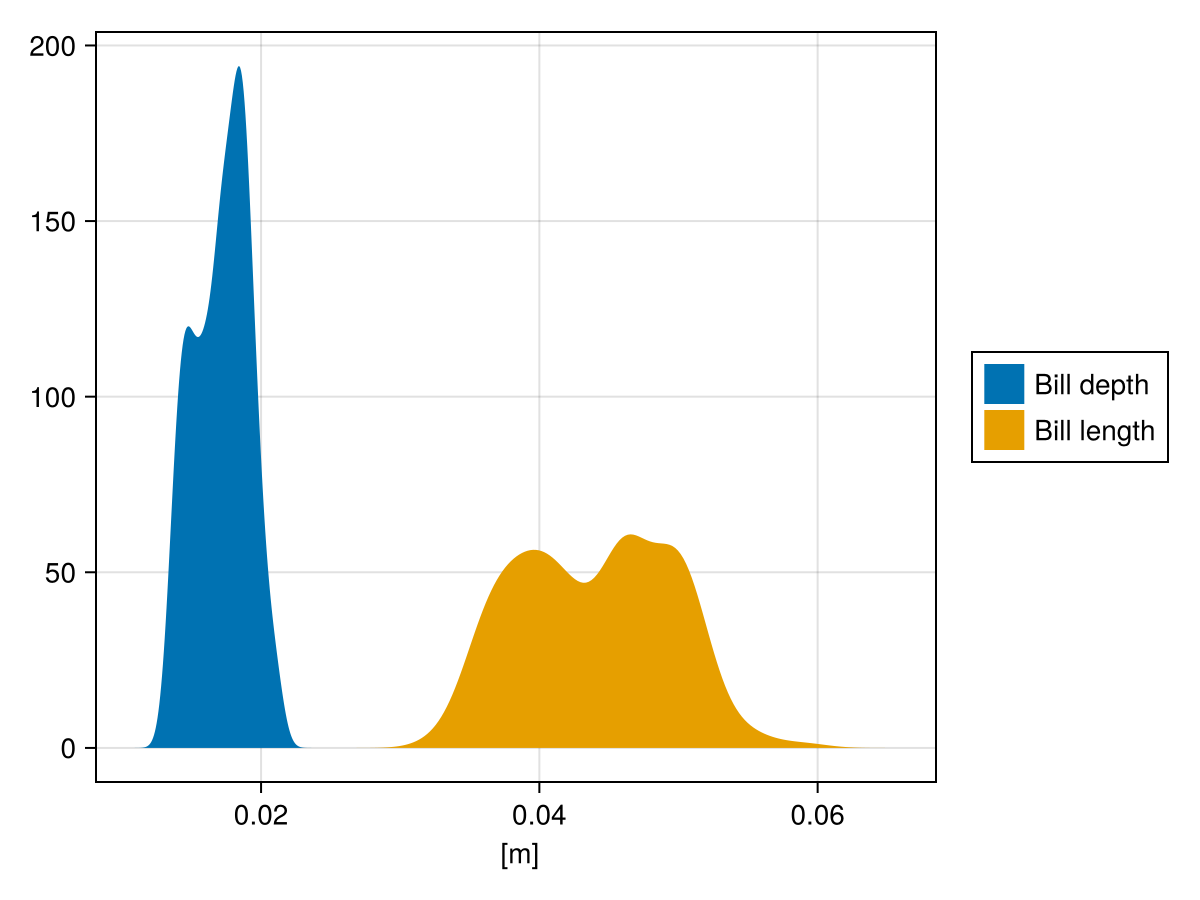
AlgebraOfGraphics will complain if we try to plot dimensionally incompatible units on the same scale:
layer1 = data(df) * mapping(:bill_length, color = direct("Bill length")) * visual(Density)
layer2 = data(df) * mapping(:body_mass, color = direct("Body mass")) * visual(Density)

draw(layer1 + layer2)
┌ Warning: Assignment to `layer1` in soft scope is ambiguous because a global variable by the same name exists: `layer1` will be treated as a new local. Disambiguate by using `local layer1` to suppress this warning or `global layer1` to assign to the existing global variable.
└ @ units.md:72
┌ Warning: Assignment to `layer2` in soft scope is ambiguous because a global variable by the same name exists: `layer2` will be treated as a new local. Disambiguate by using `local layer2` to suppress this warning or `global layer2` to assign to the existing global variable.
└ @ units.md:73
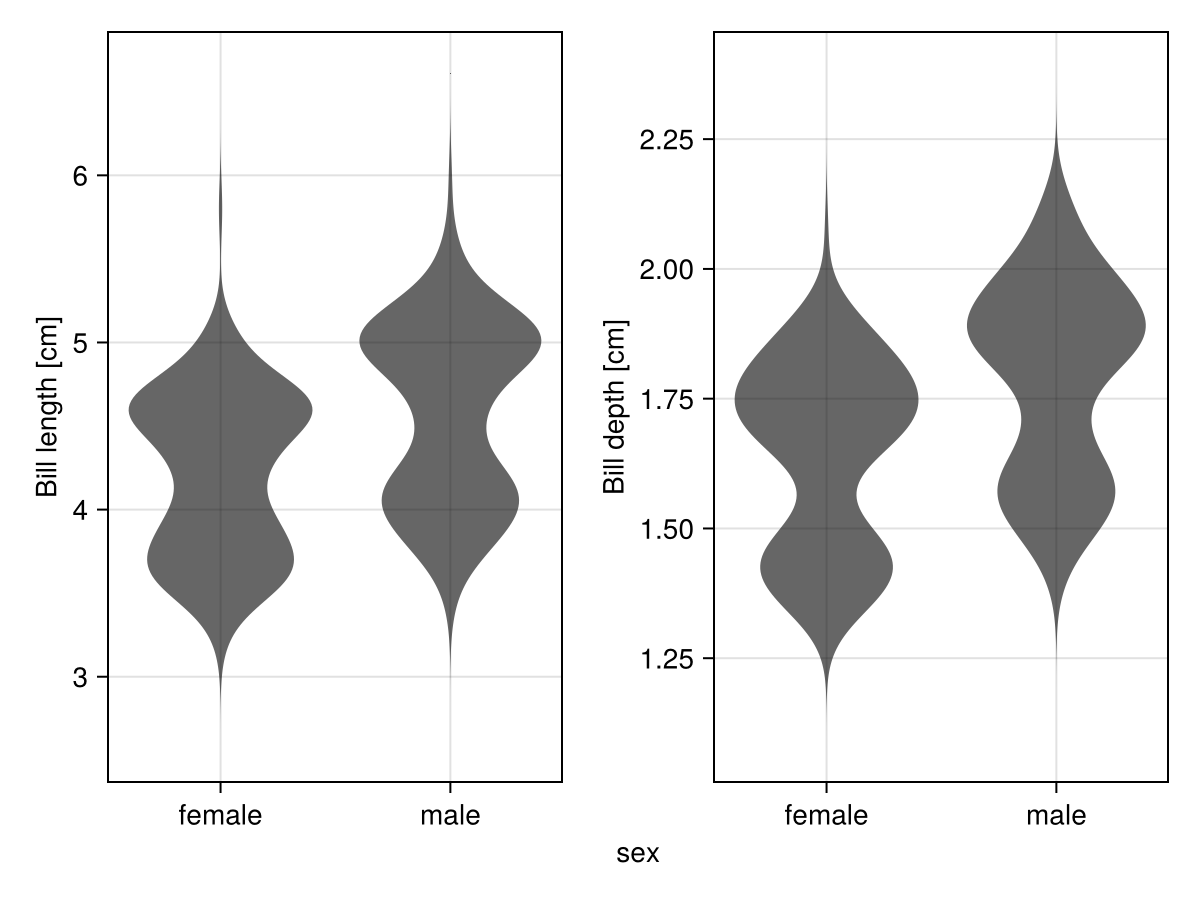
DimensionError: 2700.0 g and 32.1 mm are not dimensionally compatible.In the next example, we make a facet plot with wide data, and even though there are two y axes, there's just one underlying Y scale being fit. Therefore, both columns get unit-converted:
spec_wide = data(df) *
    mapping(:sex, [:bill_length => "Bill length", :bill_depth => "Bill depth"], layout = dims(1)) *
    visual(Violin)

draw(spec_wide)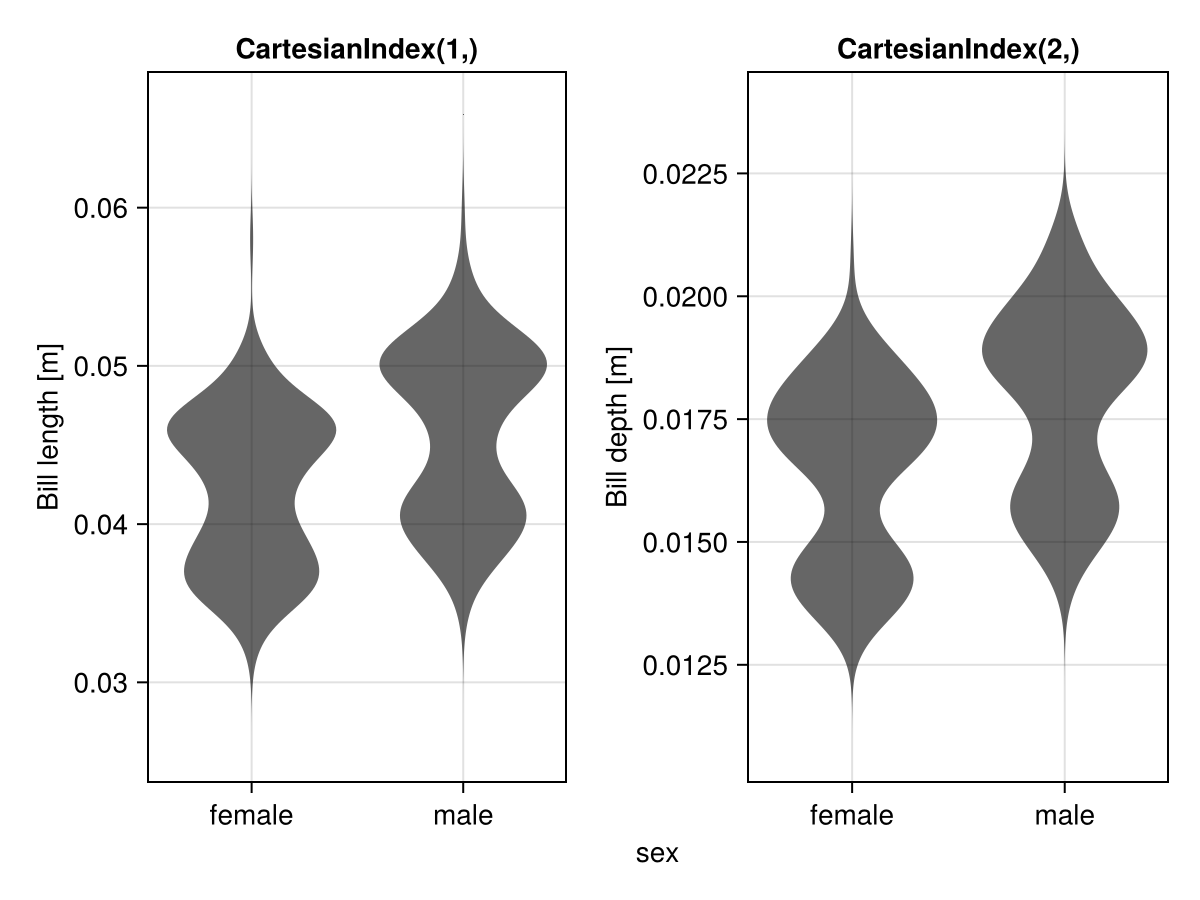
Again, we can force a different display unit via the scale options.
draw(spec_wide, scales(Y = (; unit = u"cm"), Layout = (; show_labels = false)))